Web Statistics
Hosting → Statistics lists every site on the server with its traffic over a range: which sites are busy, which are mostly crawled by bots, and which are throwing errors. The figures come from the access logs, as on the client panel’s Statistics page, and update every ten minutes.
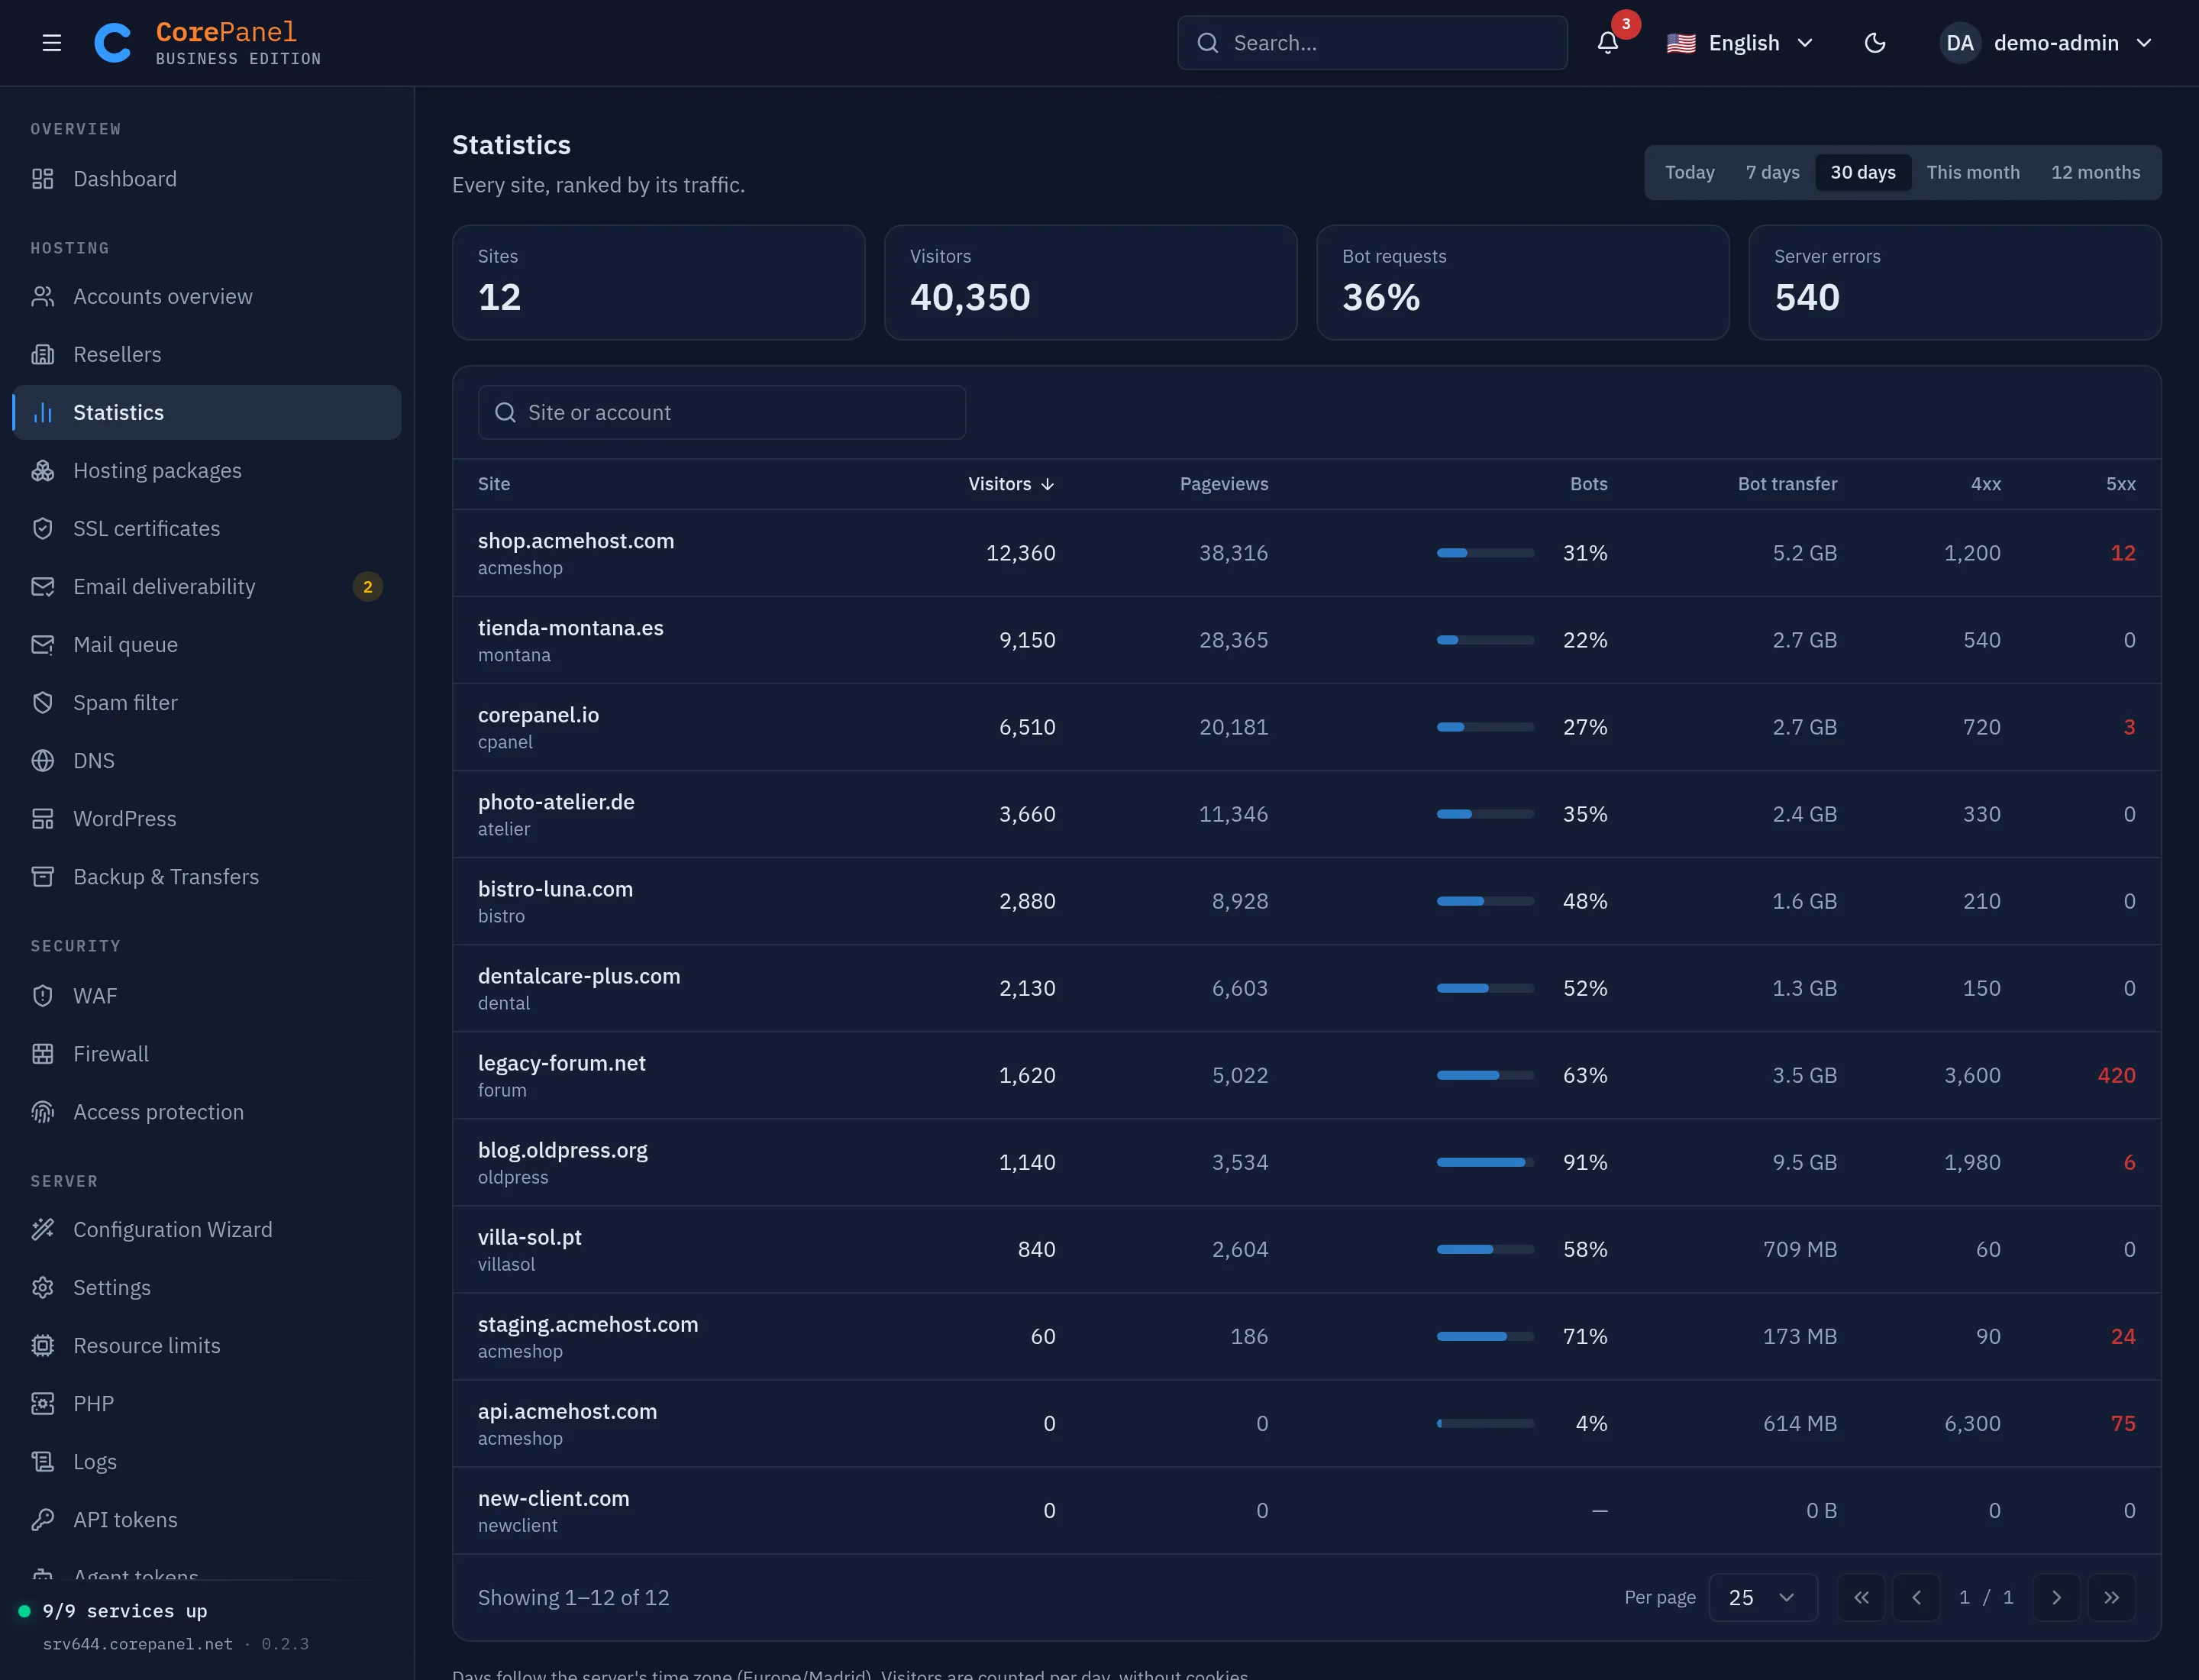
- Columns: visitors, pageviews, the bots’ share of the site’s requests, what bots were sent, and 4xx and 5xx responses. Click a column header to rank by it.
- Every site is listed, including one with no traffic in the range, so a site whose DNS never reached the server stands out. Aliases are counted under the site they point to.
- Click a site to open its own statistics, the same page its owner sees in the client panel, including the Bots and AI switches.
- Resellers get the same page over their own accounts’ sites. The counts and totals at the top cover those sites only.
- Bot transfer is counted from the release that added it; before that day it reads 0.