Running and troubleshooting
Start, stop, restart
Section titled “Start, stop, restart”The application’s detail carries the whole lifecycle in one row of buttons: Deploy, then Stop or Start depending on where it is, Restart, Edit and Delete.
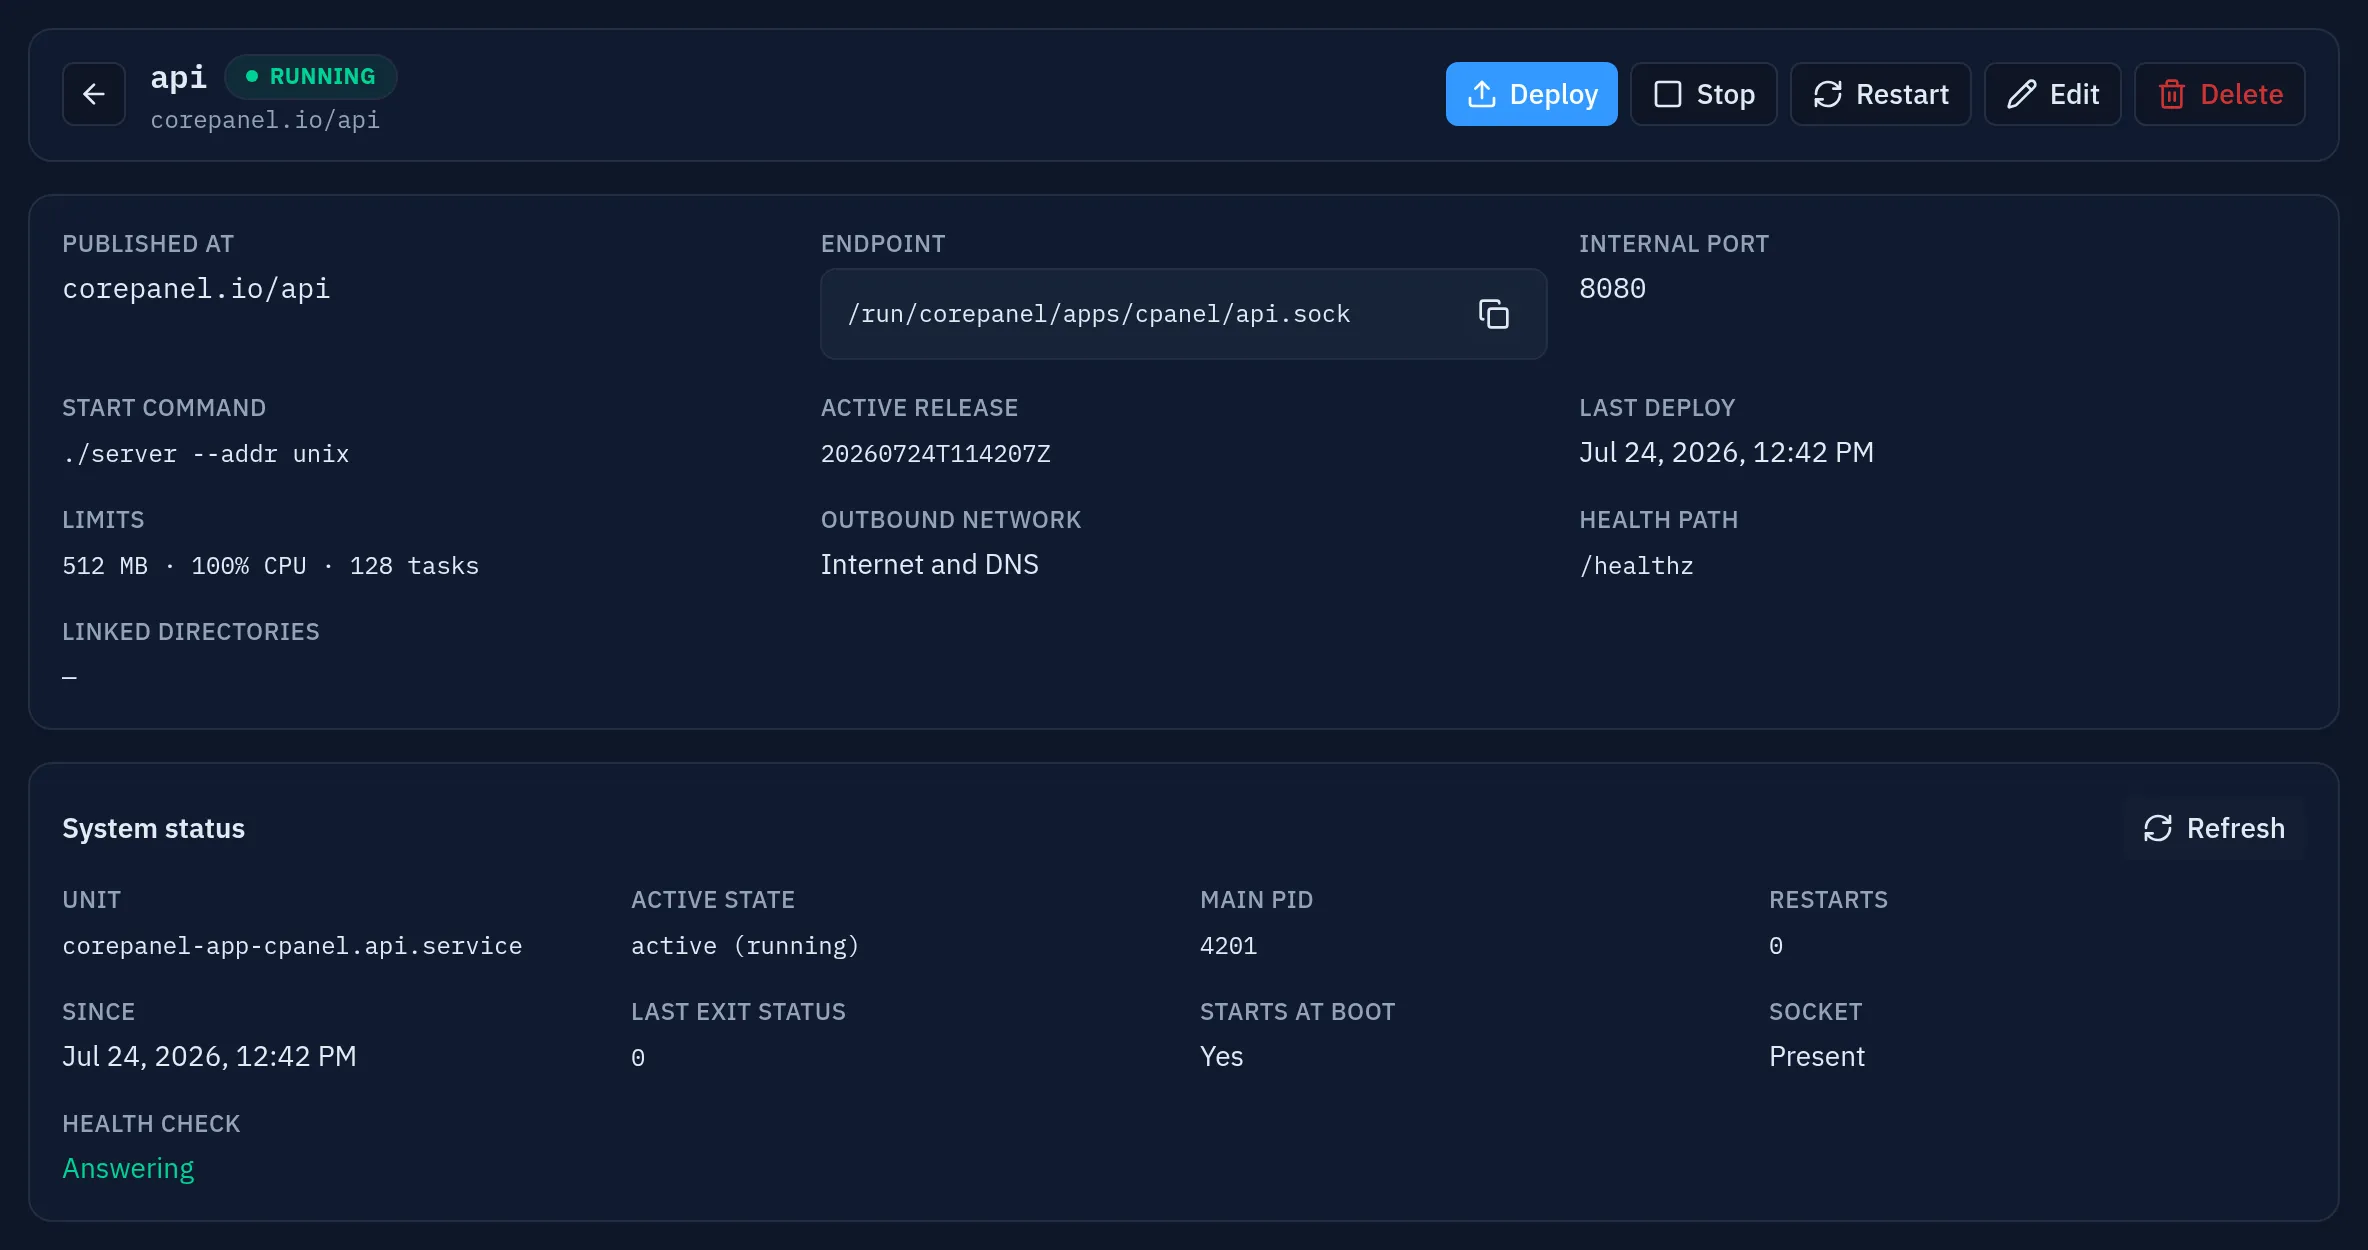
Only one of Start and Stop is offered at a time — the one that would change something — and all of them are unavailable while a deploy, a rollback or another action is still running, so two conflicting operations cannot be started by clicking twice.
The same, from corepanel:
corepanel app stop <account-id> apicorepanel app start <account-id> apicorepanel app restart <account-id> apistart and stop also decide whether the application comes back after a reboot;
restart does not change that. A stopped application keeps its releases, its data and its
route — the path answers 502 until you start it again, which is the honest answer: the
site is up, that path is not.
What the machine says
Section titled “What the machine says”Two things are on screen at once, and they are not the same question:
- State — the badge next to the name, and what CorePanel last recorded:
Running,Starting,Stopped,Failed, orNot deployedfor one that has never shipped a release. - Status — the System status card, and what systemd answers right now: unit, active state, main pid, last exit code, restart count, since when, whether it starts at boot, and whether the socket is there.
They agree while everything works and disagree exactly when something is wrong. An application CorePanel believes is running can be crash-looping, and the restart count is what tells you. The card re-reads itself every 15 seconds, and Refresh asks again on the spot.
An application registered but never deployed has no unit at all, and the card says so
rather than reporting it as dead: the unit is written by the first successful deploy. If
corepanel-sys cannot be reached, the card says that instead — the live status is
missing, the application itself is unaffected.
The same, from corepanel:
corepanel app show <account-id> apiThe health check
Section titled “The health check”Every two minutes CorePanel asks each running application whether its endpoint still answers — the same probe a deploy runs to decide whether a release is serving, repeated for the rest of the application’s life.
It exists because systemd answers a different question. active (running) means the
process has not exited; it says nothing about a program deadlocked on a database
connection, out of heap, or returning 500 to everything — all of which are, from a
visitor’s side, an application that is down. State and Status both look fine in
that case. Health check is the one that does not.
- The probe connects to the application’s socket and, if it has a health path, requests it. Anything below 500 counts as answering; a redirect counts too, because a 302 to a login page is a healthy application.
- It takes two consecutive failures to be called Not answering, so a probe that coincides with a restart is not an outage.
- On that transition it raises a notification once, to the administrator and the account owner. Not once per check: an application stays down until somebody fixes it, and an alert every two minutes is one you learn to skip.
- An application that is stopped, or has never been deployed, reads Not checked. It is not answering for a reason you already know, and a red light nobody can clear is worse than no light.
- The applications list carries a small amber warning next to the state of one that is not answering. Running and not answering is exactly the row a list would otherwise show as healthy; the reason stays on the detail.
Nothing is restarted for you. systemd already restarts a process that dies, and that is configured on every application. Restarting one behind your back on top of that would erase the evidence of the failure just found and turn a reproducible bug into an intermittent one.
corepanel app show <account-id> api# Health: NOT ANSWERING (checked 2026-08-18 09:41:02 UTC) — the health check /healthz answered 502The Logs card at the bottom of the application fetches the journal on demand: press Show logs, and the refresh button beside it re-reads the last 400 lines.

Live turns it into a follow: new lines appear as they are written, about once a second, and scrolling up stops it chasing the bottom so you can read what went past. Press it again to stop. It transfers only what is new — the panel keeps journald’s own position and asks for what came after it — so leaving it on while a deploy runs costs a couple of lines per poll rather than the whole tail each time.
The same, from corepanel:
corepanel app logs <account-id> api # last 200 linescorepanel app logs <account-id> api -n 1000 # up to 2000corepanel app logs <account-id> api --follow # until you interrupt itThe journal carries your program’s own output and the gateway’s, so a failure to bind the socket and a panic inside your handler both land in the same place. There is nothing to configure and no log file to rotate: write to stdout and stderr.
On the server itself, journalctl -fu corepanel-app-<account>.<app> is the same journal.
Diagnosing
Section titled “Diagnosing”An application that failed says why on its own detail, before you open the journal: the state badge reads Failed, a Last failure band carries the reason, and the System status card underneath tells you whether it is dead or looping.
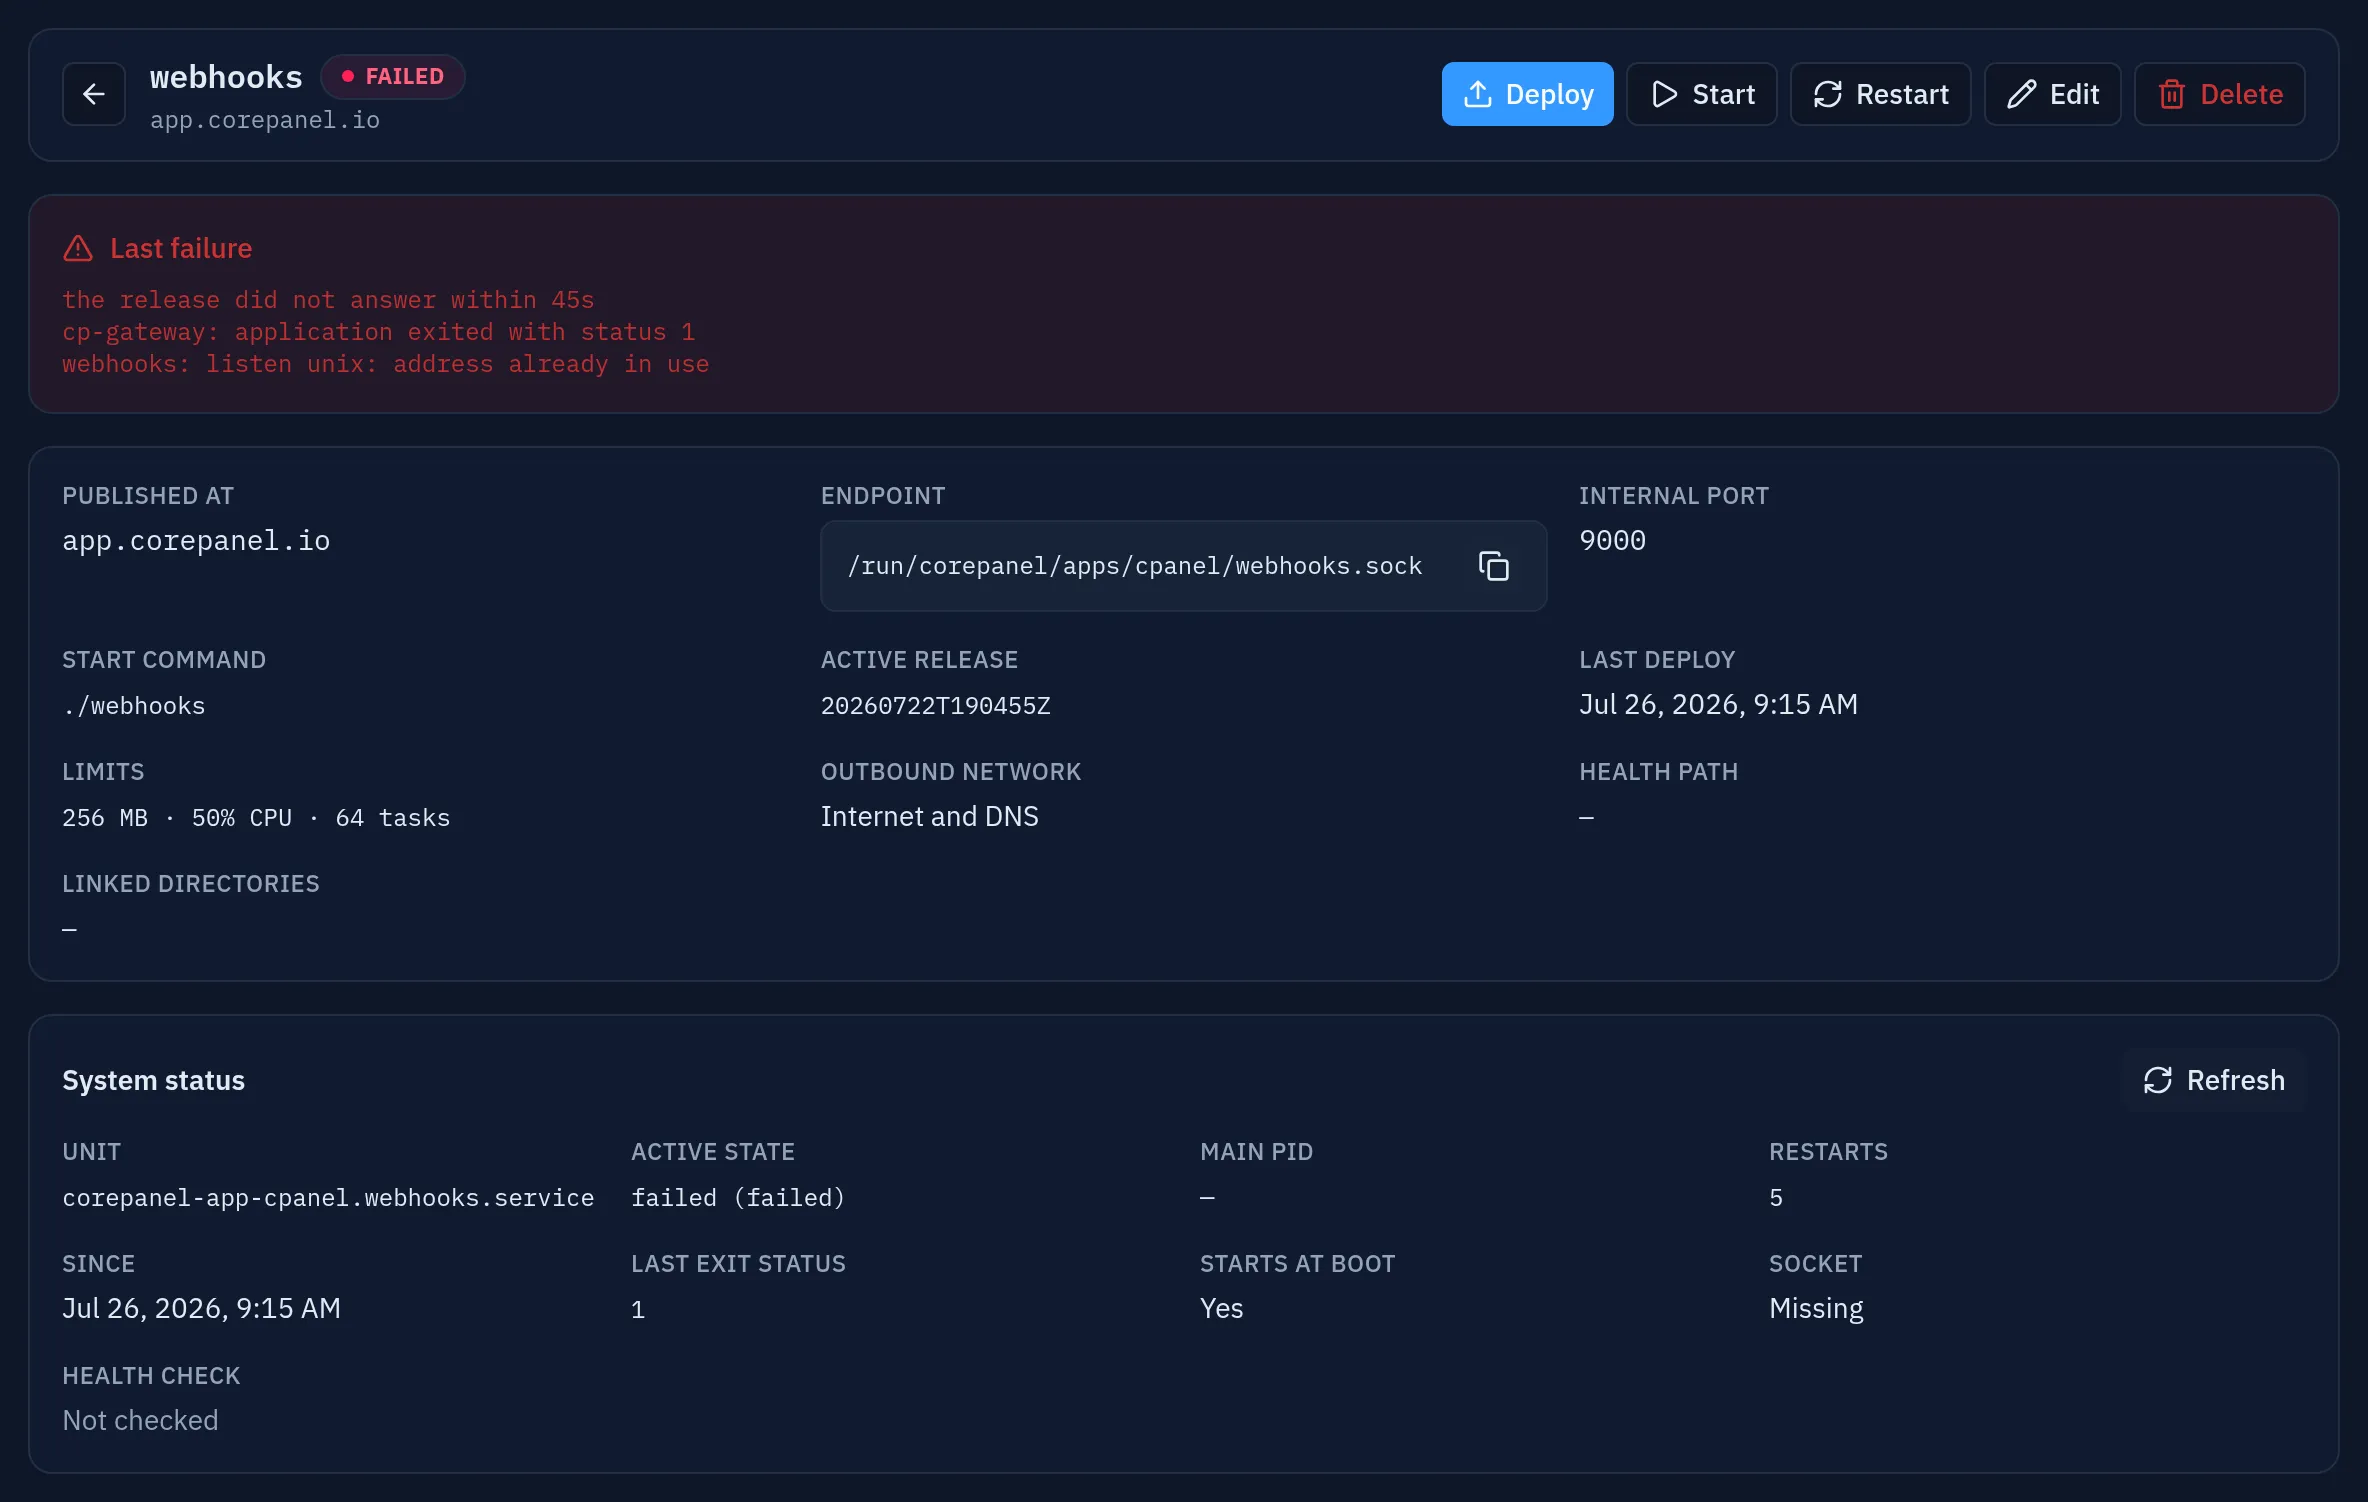
Read the three together. Above, the release did not answer within 45 seconds, the program exited with status 1, and it could not bind its socket — the port was already taken inside its namespace. Restarts: 5 and Socket: Missing confirm it never got far enough to listen, so this is a startup failure, not a request that went wrong.
The path answers 502
Section titled “The path answers 502”The web server reached the socket and got nothing back. In order of likelihood:
- The application is stopped. The state badge says so — start it.
- It is crash-looping. A rising restart count and a repeating error in the journal. The most common causes are a missing environment variable and a port mismatch.
- It is not listening on
$PORT. The program binds a hardcoded port different from the one configured. Either read$PORTor pass the same number in the start command. - It is wedged, not dead. Accepting connections and never answering.
restartis the fast answer; a health path is what stops the next deploy from shipping it.
The deploy rolled itself back
Section titled “The deploy rolled itself back”That is the safety net working: the release did not answer, so the previous one was put
back. The reason is on the application (lastError) and in the journal, and the tail of
the journal is included in what the deploy reported.
Reproduce it outside CorePanel before deploying again: unpack the same archive on your
machine, cd into it, and run the same command with the same variables. The working
directory is the release root, and a program that only works because your shell exported
something is the most frequent cause.
It was killed with no message
Section titled “It was killed with no message”Look at the memory ceiling. A process that exceeds --mem is killed by the kernel — there
is no graceful signal, no stack trace, and often nothing in the journal but the restart.
The limits are on the summary card (256 MB · 50% CPU · 64 tasks) and the restart count
right below it; Edit raises the ceiling. From the command line:
corepanel app show <account-id> api # limits and restart countcorepanel app update <account-id> api --mem 512If it is killed again at a higher ceiling, it is a leak, not a limit.
Deploys are refused with “a deploy is already running”
Section titled “Deploys are refused with “a deploy is already running””One deploy at a time per application, shared by the panel, the CLI and the webhook. Wait for the running one; it finishes in seconds or fails on its own timeout. This also blocks deleting the application while a deploy is in flight, which is deliberate — a delete halfway through an extraction would leave files behind.
Deleting
Section titled “Deleting”Delete on the application asks once, and the question that matters is the toggle:
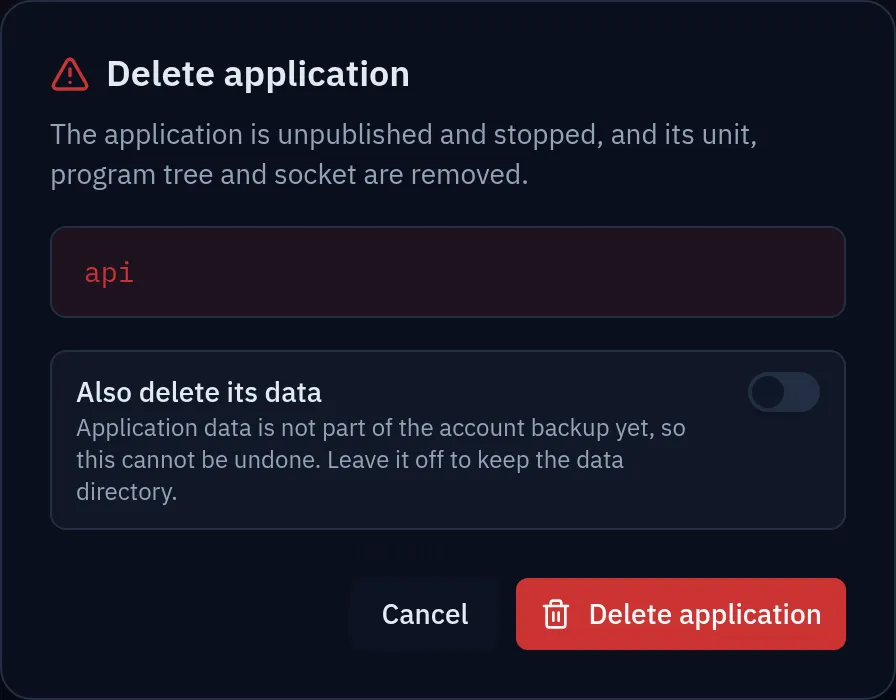
The same, from corepanel:
corepanel app delete <account-id> apiThe application is unpublished, stopped, and its unit, program tree and socket are removed. The path goes back to being served from the document root, and the site is left healthy — there is no window in which it 502s.
The data directory is kept unless you turn Also delete its data on, or pass
--purge-data. It is the one thing a redeploy cannot recreate, so destroying it takes
saying so — and the toggle starts off every time the dialog opens, however you left it
last.
Deleting a domain that still publishes applications is refused with a message naming
them; corepanel domain delete --force removes them in cascade. Deleting the account
removes them with their data, as with everything else the account owns.
Applications in an account backup
Section titled “Applications in an account backup”An account backup carries its applications: each one’s settings, its
environment variables — secrets included — its $CP_APP_DATA volume, and the release
it was running. A restore recreates the application, puts the data volume back, deploys
that release, and republishes the route, so the path that answered before the backup
answers again afterwards.
Three details are worth knowing before you need them:
- Only the release that was running is archived. The earlier releases are recorded as history, but their code is not in the archive: a restored application has nothing to roll back to until you deploy again. A backup restores the state that was working, not the deploy history — archiving all four retained releases would multiply the size of every archive to provide a rollback target nobody expects a restore to offer.
- The restored release gets a new reference. References are timestamps the server
mints, so the release that was
20260817T101500Zcomes back under today’s. The job report maps one to the other. - The archive holds working credentials. Environment secrets and the deploy token travel in the clear inside it, because a DSN the operator cannot recover is a restore that does not restore. Archives are readable by super-administrators only, and the job report warns when one carries application secrets. Treat it as you would a password store.
The database given to an application is
backed up as an ordinary MySQL database, and the restore re-links it to the application by
name — the schema, its rows, its user and the CP_DB_PASSWORD variable all come back, so
there is nothing to re-attach by hand.
If an application’s target domain did not come back — its own restore step failed — that application is skipped and named in the report: an application has to be published somewhere, so there is no half-restored state to leave it in.
What survives what
Section titled “What survives what”| Deploy | Rollback | delete | delete --purge-data | Account backup | |
|---|---|---|---|---|---|
| Program tree | replaced | replaced | removed | removed | the active release |
$CP_APP_DATA | kept | kept | kept | removed | included |
| Environment variables | kept | kept | removed | removed | included, secrets too |
| Releases (last 3) | pruned to 3 | kept | removed | removed | history only, no code |
| The route | kept | kept | removed | removed | rebuilt by the restore |
| MySQL databases | kept | kept | kept | kept | included |
| Its MySQL user | kept | kept | dropped | dropped | n/a |