Reading logs
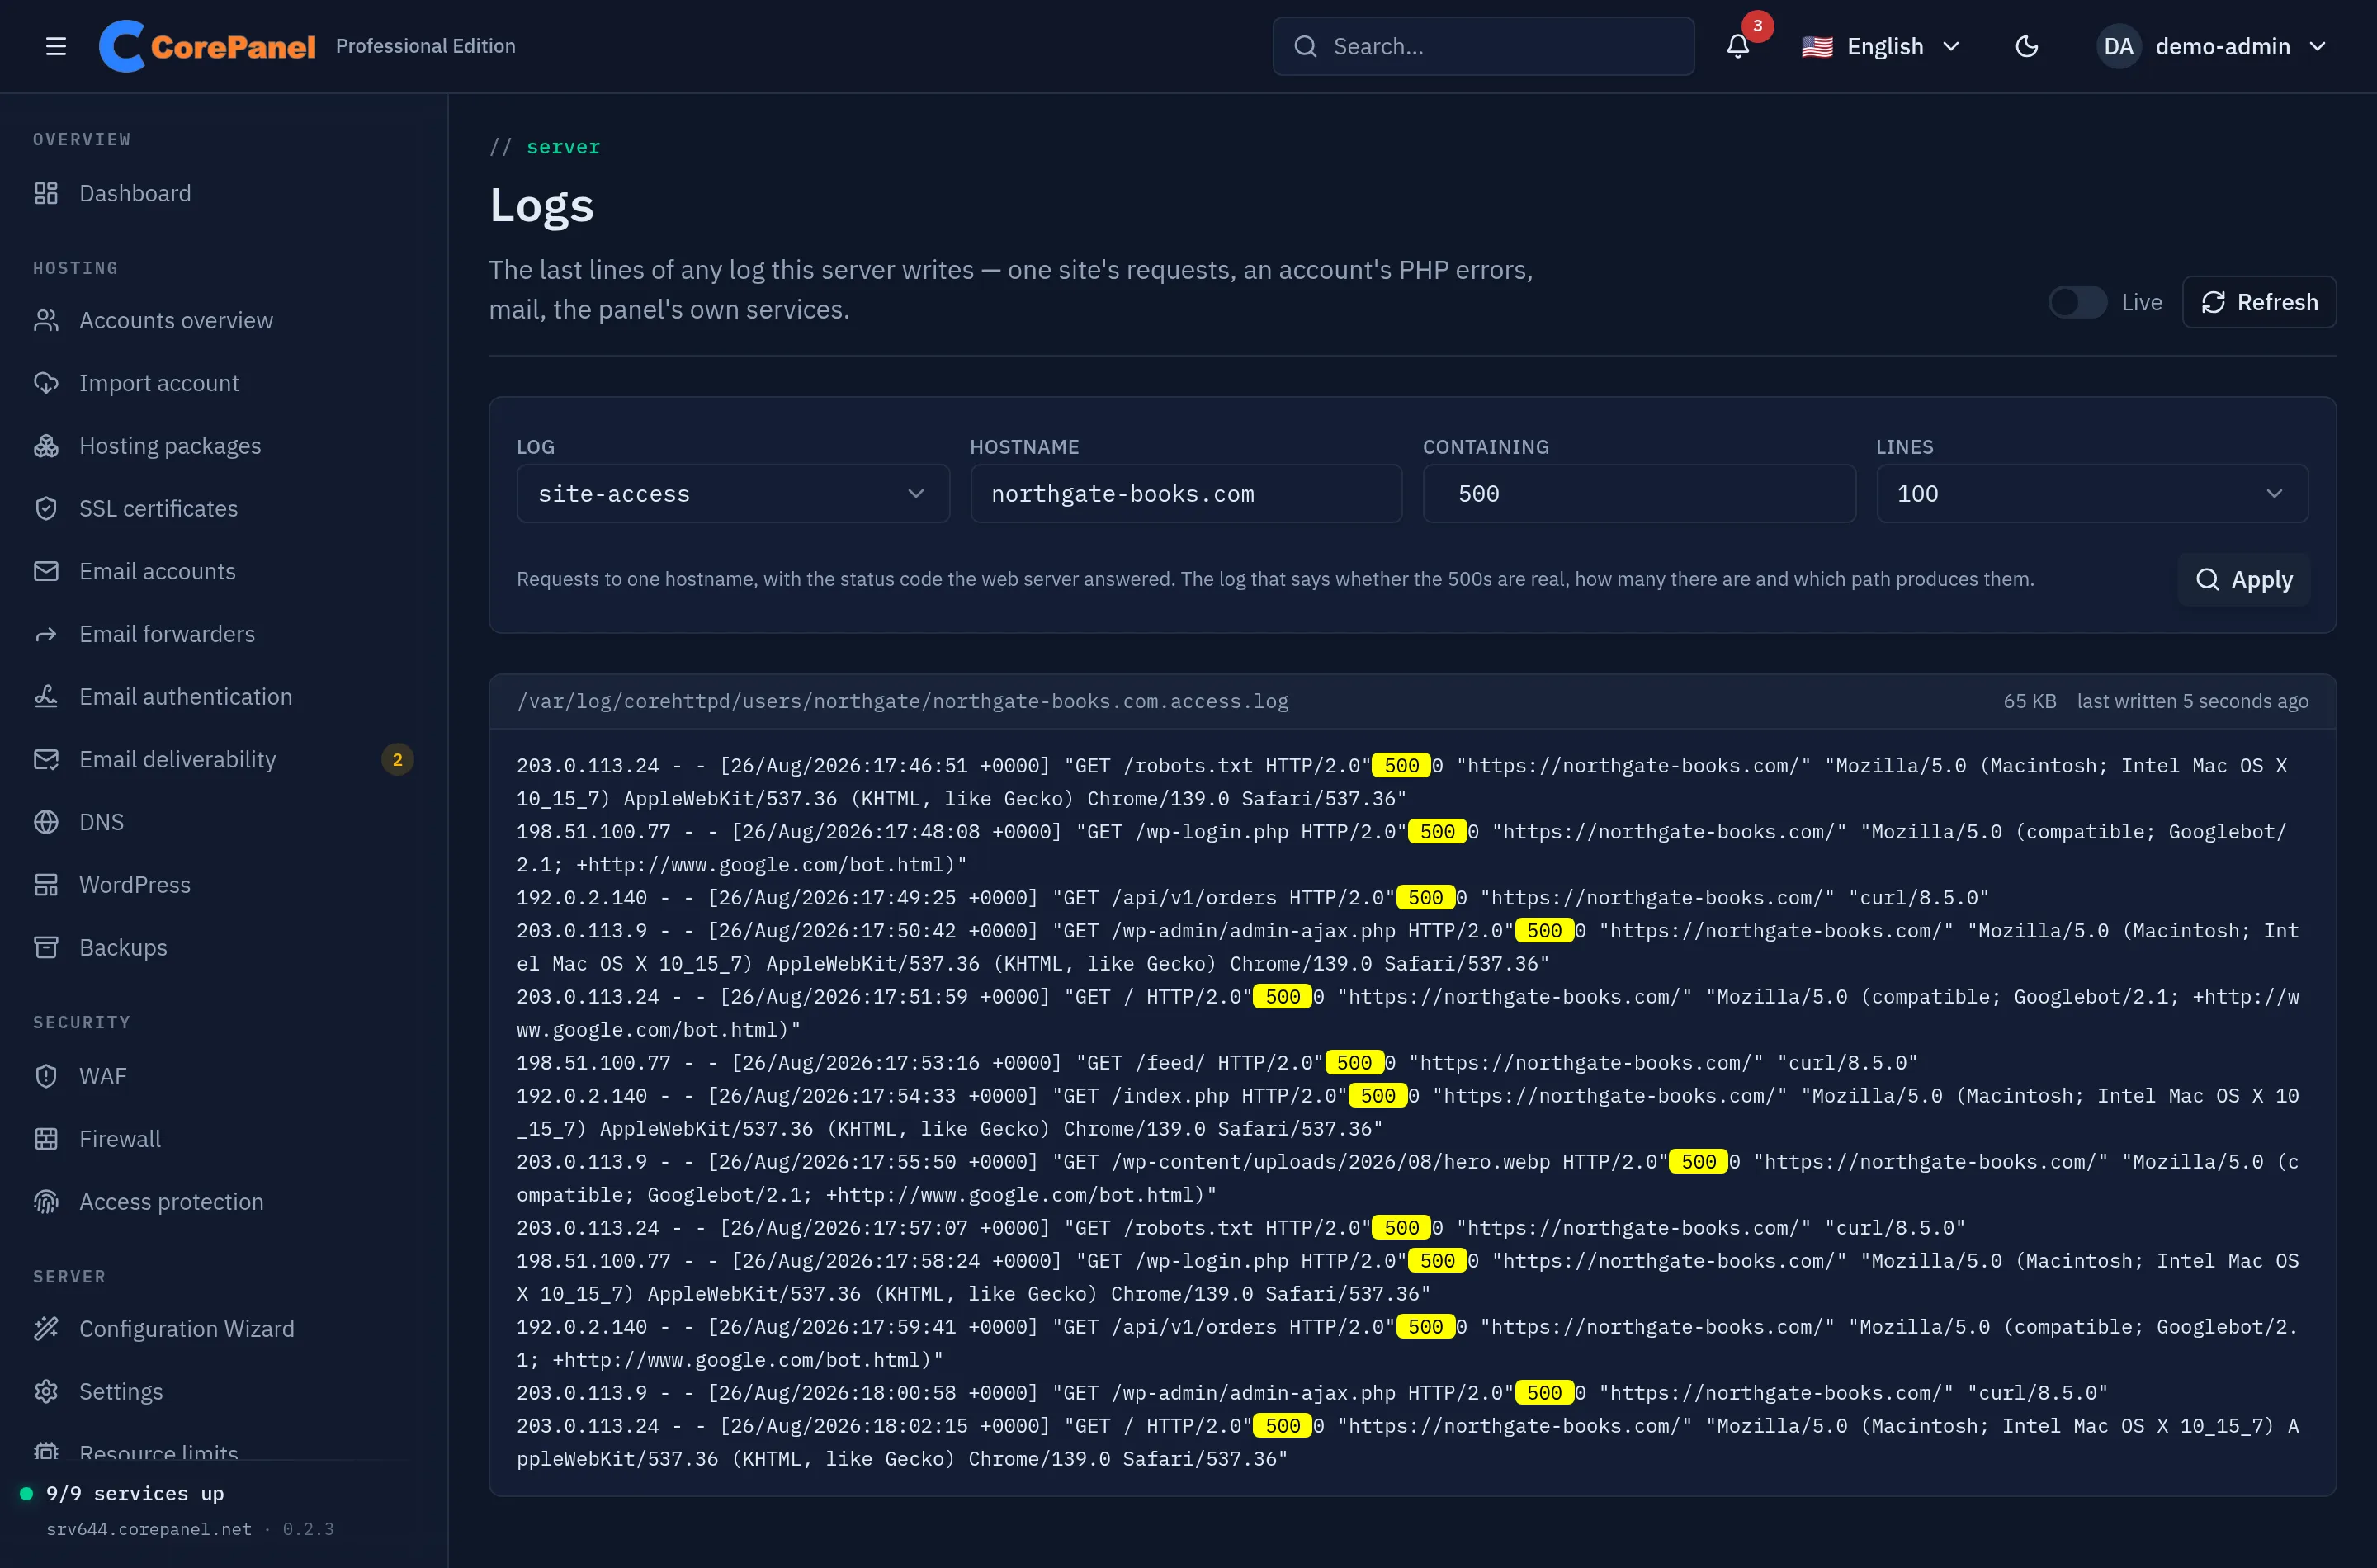
Server → Logs shows the tail of any log this server writes, without an SSH session.
It exists for one question above all others: this site is returning 500s — why? Two logs answer it between them, and both are here.
Available on every edition. Super-administrators only.
Choosing a log
Section titled “Choosing a log”The picker is grouped by what a log covers, because that is what decides whether it needs anything alongside it:
| Group | Logs | Needs |
|---|---|---|
| One site at a time | site-access | a hostname |
| One account at a time | php-error, php-access | an account |
| The whole server | everything else | nothing |
| Log | What it answers |
|---|---|
site-access | Requests to one hostname, with the status code that was answered |
php-error | PHP warnings, fatals and stack traces, for one account |
php-access | One line per PHP request of an account, with time and memory used |
web-error | The web server’s own errors, server-wide |
web-access | Requests to the panel’s own hostname |
mail | Postfix and Dovecot |
database | MariaDB: crashes, refused connections, tables it could not open |
dns | The authoritative nameserver: zones it refused, queries it could not answer |
ftp | The FTP daemon: sessions, transfers, connections turned away |
panel-core, panel-sys, panel-api, panel-auth | CorePanel’s own services |
Three of those — database, dns and ftp — have no file of their own on a stock
install: MariaDB, PowerDNS and pure-ftpd write to the systemd journal, so that is where
CorePanel reads them from, and the header above the pane says so. A database that has
been given a log_error is read from the file instead.
You do not always have to pick: View log on a service in the dashboard’s
service status opens this screen on that service’s log
already chosen — the address is /logs?log=mail, so it can be bookmarked or shared with
a colleague who has the same access.
A server-wide log that nothing is writing to is marked in the picker before you open it. That is worth more than it sounds: an empty pane and a silent daemon look identical, and only one of them is a problem.
Chasing a 500
Section titled “Chasing a 500”- Pick
site-accessand name the site. Type500in Containing to keep only the lines that mention it — the answer to are the 500s real, how many, and on what path. - Switch to
php-error. The site’s account stays selected, so this is one click. If the 500 is the code, the fatal is here, with the file and the line.
web-error is the third one to try when neither of those explains it: a site that will
not start, a certificate that will not load, an upstream that did not answer.
Access logs are per hostname
Section titled “Access logs are per hostname”example.com and www.example.com are two different logs. A request is recorded
under the name it arrived on, so a site that answers for both writes both, and asking for
one does not show you the other. The hostname box suggests the domains this server hosts
and accepts anything you type, which is how you reach the www. log — it is a real log
that is not a row in any list.
Subdomains and addon domains each get their own log too, for the same reason: each has its own virtual host.
What “that is all there is” means
Section titled “What “that is all there is” means”Every read is bounded — a line count with a ceiling of 500, a maximum line length, a total size, and a limit on how far back the file is walked when you filter it. Whichever bound fired is stated under the pane, in words.
That line is the difference between “that is all there is” and “that is all I looked at”. Nothing printed means you are looking at the end of the log. “There are older lines above these” means you are looking at a slice of it, and a match you did not find may still exist further back.
Live re-reads the log every ten seconds. It keeps the pane pinned to the newest line while you are at the bottom, and stops following as soon as you scroll up to read something.
Why there is no download
Section titled “Why there is no download”The screen reads named logs — site-access, php-error — and the list of names, with
the paths behind them, is compiled into the privileged daemon that owns the filesystem.
There is no path box, no download and no “open the raw file”, because all three would turn
a bounded read of a known log into file access, which is the property the design exists to
keep.
Control characters in a log line are escaped rather than removed, so an escape sequence
somebody sent in a user agent is inert on screen and still visible to you. Colour is the
one exception: CorePanel’s own daemons paint the timestamp and the level of every line
they write to their log files, and those sequences are dropped instead of escaped — they
are decoration of ours, not evidence of anything, and escaping them buried the message
under \x1b[90m…\x1b[0m. Colour cannot move the cursor or erase the screen, so nothing
that could rewrite what you are reading is removed along with it.
Reading logs is a super-administrator capability, like the firewall and mail deliverability: one line of a mail log names three tenants at once. An account holder signed into the client panel has no version of this screen.
The same logs from an AI assistant
Section titled “The same logs from an AI assistant”An assistant connected over MCP reads exactly these logs, by the same names,
through the read_logs tool — the same allow-list, the same bounds, the same refusals.
“example.com is returning 500s — what is in its logs?” is a question it can answer for
itself.
See also
Section titled “See also”- Web Traffic Graphs — request rates and latency, for the whole server
- The Dashboard — which services are up, before you go looking in a log
- MCP for AI agents — the same reads, for an assistant