The Dashboard
The dashboard answers one question — is the server healthy right now? — before you go looking for anything specific.
Resource cards
Section titled “Resource cards”| Card | Shows |
|---|---|
| Disk usage | Used space against what the server has |
| Current load | 1, 5 and 15-minute load averages, plus CPU usage |
| Memory usage | Used memory against total |
Read them together rather than one at a time. A high 1-minute load with a normal 15-minute average is a burst; all three high is a server that has been struggling for a while. Memory near the top with rising load usually means swapping, which shows up to customers as a site that has become inexplicably slow.
Disk is the one to act on early: a full disk breaks mail delivery, database writes and backups at the same time, and it does it without warning.
Service status
Section titled “Service status”The stack CorePanel manages, each reported as Online, Degraded or Offline:
- Web server — serves the hosted sites and the panel itself
- Postfix and Dovecot — sending, and IMAP/POP3 for mailboxes
- FTP — file transfer for accounts
- SSH — administrative access
- DNS — the authoritative nameserver for hosted zones
- MariaDB — the databases of every hosted account
- PHP 7.4, PHP 8.4, … — one row per PHP branch installed on this server
A summary line tells you how many of them are up. This is the fastest triage available: “mail is not arriving” plus an offline Postfix is a different investigation from “mail is not arriving” with the whole stack green. The database and the PHP rows are the ones to look at first when sites return a 500 error: between them they account for most of the 500s a hosting server produces, and either one being down explains it in one glance.
PHP is not a single service. Each installed branch runs its own FPM master, so each gets its own row: PHP 8.4 offline breaks the sites assigned to 8.4 and leaves the rest serving normally. Installing a new PHP version adds a row; removing one takes it away.
A service this server does not have is not listed at all, rather than shown as failed — a machine with no database has no database row. What is shown as Offline is a service that is installed and not running, which is the alarm the card exists for.
Web traffic
Section titled “Web traffic”Live request and latency graphs for what the server is actually serving. They have their own page: Web Traffic Graphs.
Failed logins
Section titled “Failed logins”Mail and FTP sign-ins this server rejected over the last day, with the worst few source addresses named. When one address is working through several accounts — the shape of a dictionary run rather than a forgotten password — the card says so, and selecting an address opens Access Protection filtered to it.
The card is shown to super-administrators only, and removes itself entirely on a server whose authentication broker keeps no audit trail.
PHP versions
Section titled “PHP versions”How many accounts are running a PHP version that no longer receives security fixes — with each version linking to the accounts on it, so the number is a work list rather than an audit you do account by account.
The card also flags an account pinned to a version that is not installed on this server, and a version somebody installed outside CorePanel. It removes itself when there is nothing to report, and it is never shown to an account holder. See How long each version is supported.
cPanel is still installed
Section titled “cPanel is still installed”Only on a server that was transformed from cPanel, and only until the old panel is gone.
A transformation leaves cPanel installed and stopped on purpose: that is what keeps
corepanel-transform rollback possible. Removing it — corepanel-transform cleanup — is
never automatic and never part of the same sitting as the cutover, because it is the one
step of the whole move that cannot be undone. It waits for you to type ERASE-CPANEL on
a terminal, days later, once you have watched the server.
The card is what remembers that for you. The CLI says it at the end of the run and in
corepanel-transform status, and after that the only record of it is a shell scrollback
that is gone by morning — so a server can quietly keep a few gigabytes of a dead panel,
and its dnf repositories, indefinitely.
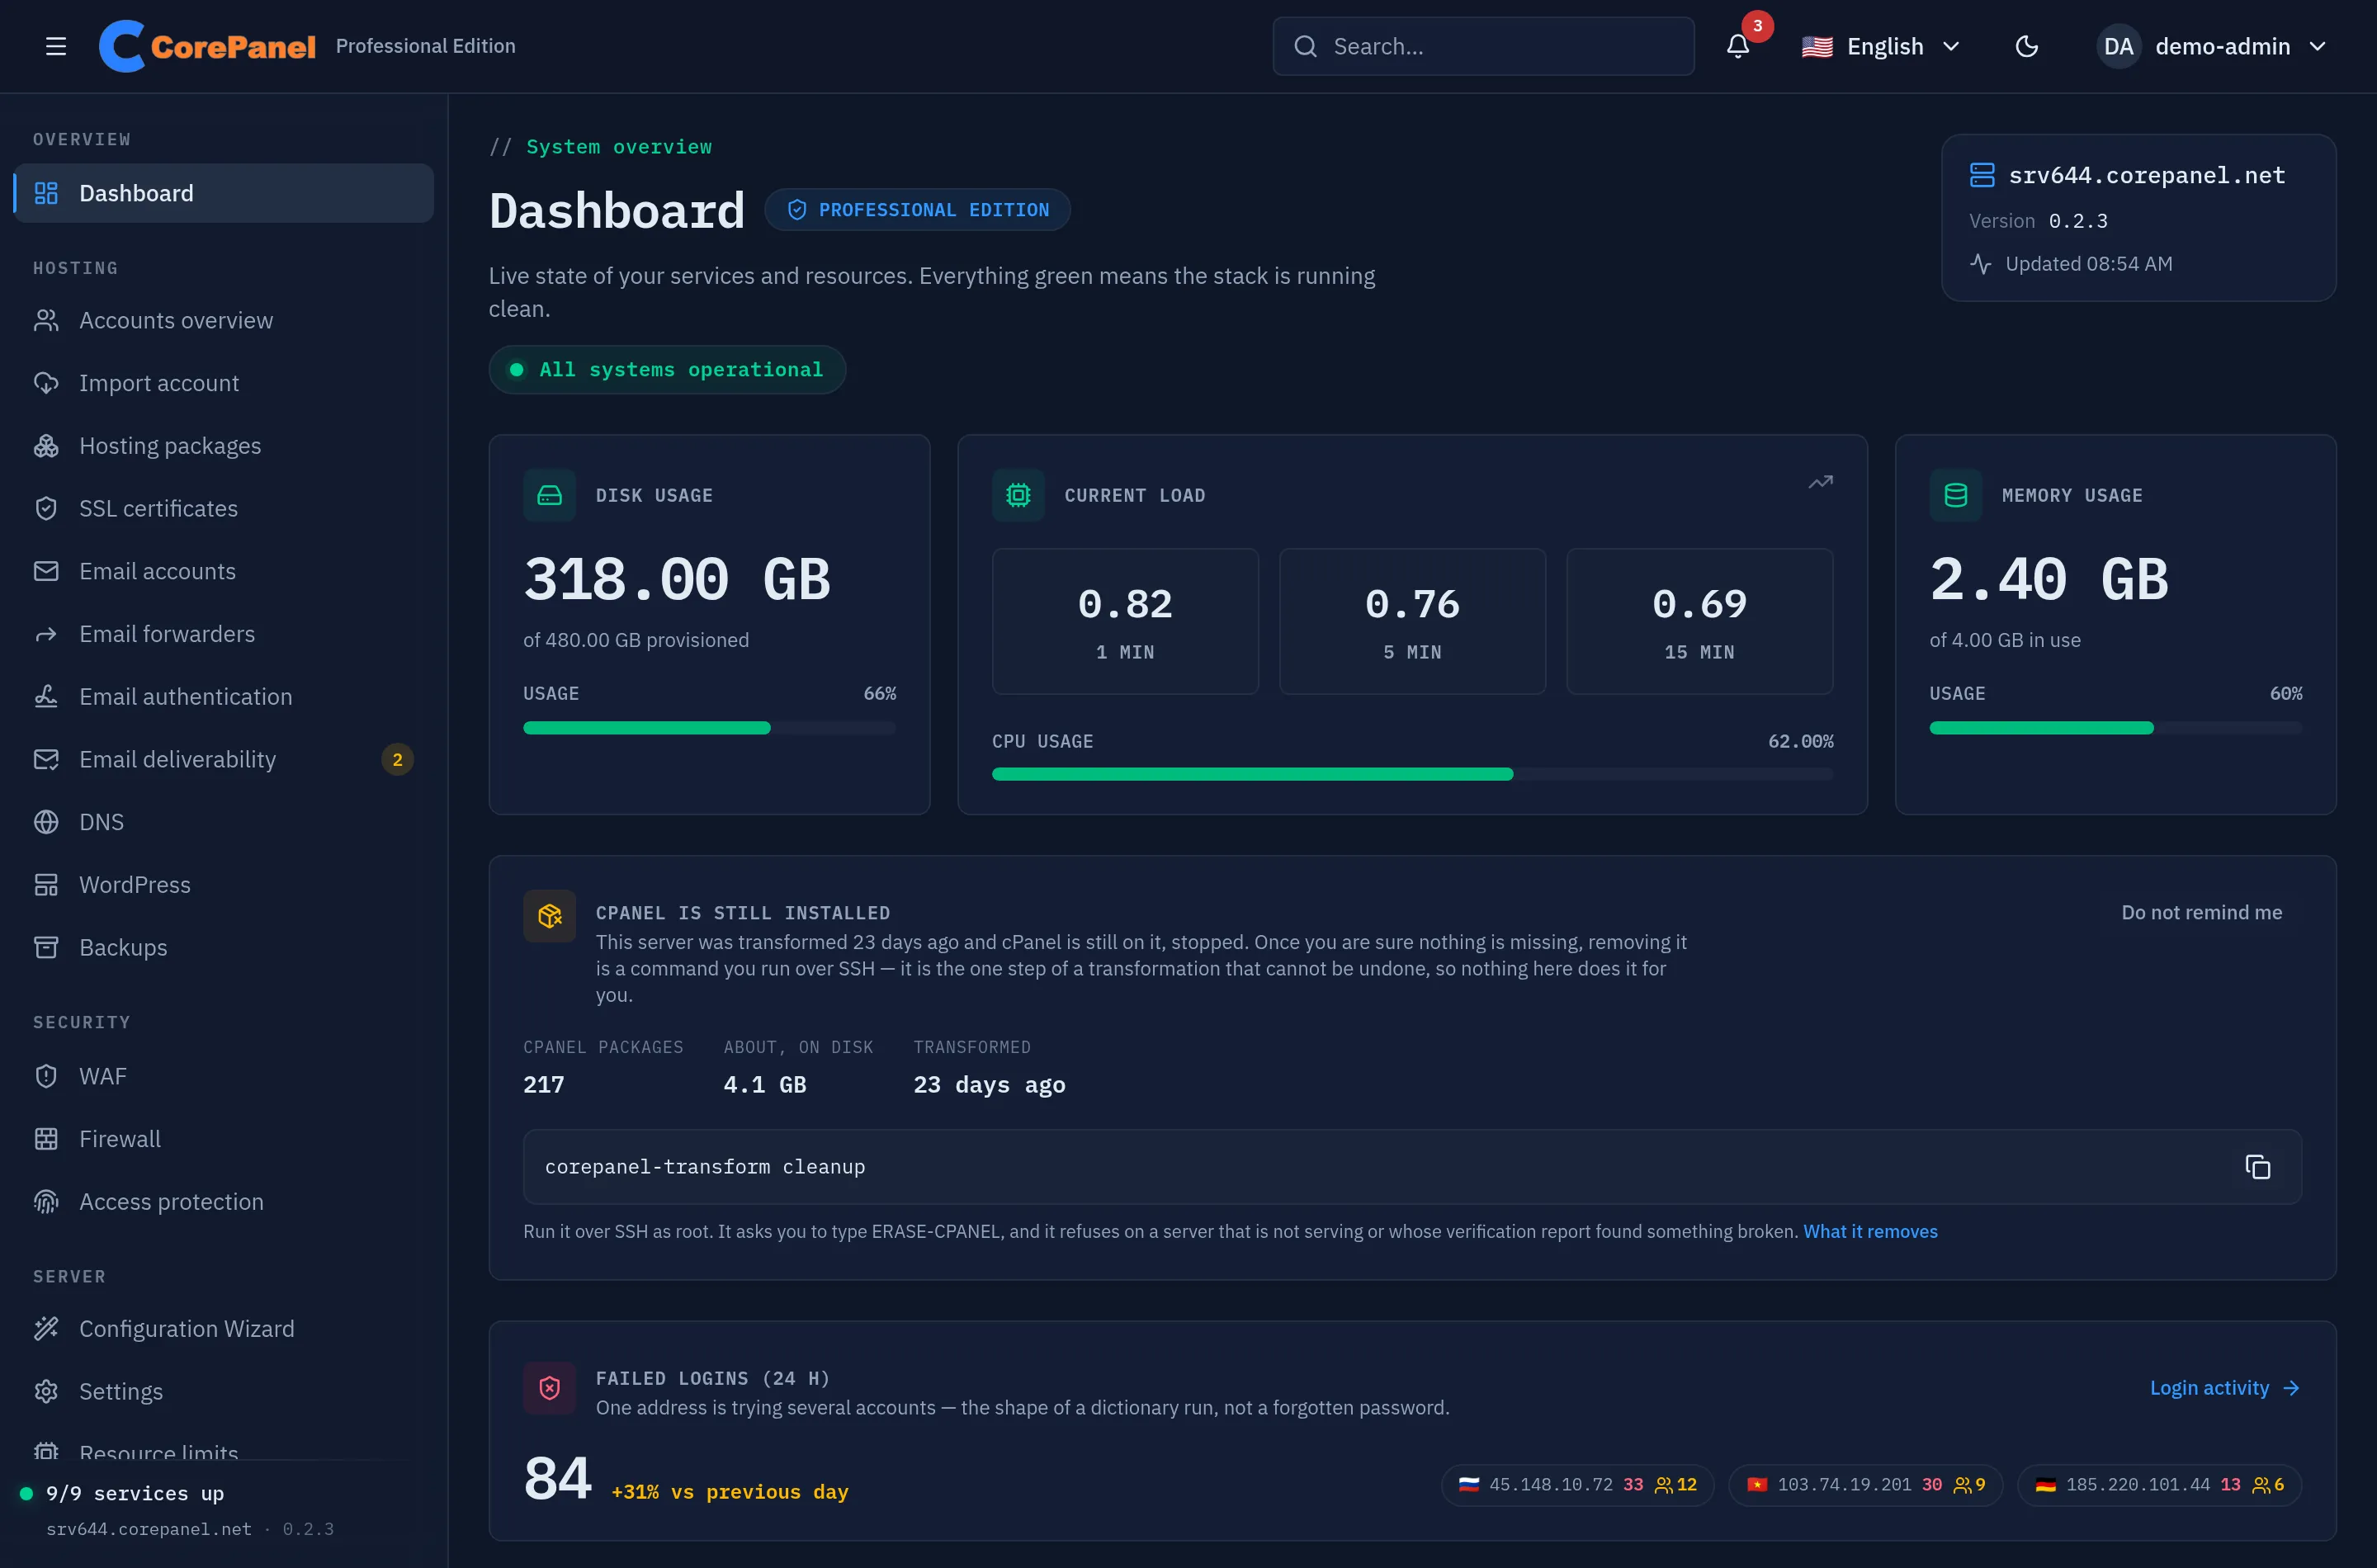
It reads how many cPanel packages are still on the server and roughly what they occupy, and it changes its tone rather than its facts:
- For the first week it describes the situation and says why it is deliberate — the way back is still the point, and nothing here pushes you towards closing it.
- After that it says how long it has been, with the days on the clock.
The command is there either way, ready to copy. If the cutover went through and you are happy with what you see on day one, there is no reason to make you wait a week — or go digging through a shell scrollback — to find the one command that finishes the job.
What the card never does is run it. A button on a web page for something that asks to be
typed out in full would defeat the reason it asks: you run it over SSH as root, and it
asks you for ERASE-CPANEL when you do.
The card disappears on its own once cPanel is gone: what it goes by is what is
actually installed on the machine, not a record of whether anybody ran anything, so
there is no state that can be wrong about it. If you are deliberately keeping cPanel
where it is, Do not remind me silences it — that changes nothing about the server,
and corepanel-transform status still lists the cleanup as pending.
Super-administrators only, and absent from every server that was never transformed.
Header
Section titled “Header”The header carries the server’s hostname, the CorePanel version and the edition in use — worth knowing before you go looking for a feature that belongs to a different edition, and the first thing to quote when you report a problem.
It also carries the language menu. The panel is translated into English, Spanish, German, Indonesian and Brazilian Portuguese, and the globe switches between them here and on the login form. Your own choice lives in this browser, not on the server: it follows you between tabs on this machine and not to the next one, which is the right trade for an administrator who is usually at one desk. A browser that asks for a language the panel does not speak gets English rather than a half-translated screen.
Your customers get the same five languages, but their choice is stored on the account instead — so it does follow them to their phone.
The sidebar, collapsed
Section titled “The sidebar, collapsed”The menu on the left has two widths, and the icon at the far left of the header switches between them. Collapsed, it does not go away: it becomes a column of icons, so the section you are in stays marked and every other one stays one click away.
Point at the column — or tab into it — and it opens back over the page, labels and all, without pushing the content aside. Move away and it returns to icons; the header icon is what makes the full width stick.
CorePanel collapses it for you when you open something that deserves the room: an account, a mailbox, a WordPress site. Those screens carry a menu of their own, and two full-width menus either side of the content leave little content. Expanding it yourself while you are in one of those overrides that until you leave.