Web statistics without a script, a cookie banner or GoAccess
Every CorePanel site gets Plausible-style statistics read from the server's own logs, plus what no tag can see: which bots and AIs crawl it, and a switch to stop them.

In short: every site on a CorePanel server now has its own statistics page, in the style of Plausible: visitors, pages, sources, campaigns, countries and devices, with filters that combine. Nobody installs a script, visitors see no cookie banner, and no IP address is ever stored. Because it reads the web server’s own logs, it also sees what a JavaScript tag never can: every bot and every AI that crawls the site, how much data each one was sent, and a switch to turn it away. It works on every edition, including the free Personal edition.
Two panels, one answer, and it is from 2009
Hosting panels used to ship three log analysers: AWStats, Webalizer and Analog. cPanel has deprecated all three and points to GoAccess as their replacement. Plesk made GoAccess its default in 18.0.77. GoAccess is a fine tool, but what a hosting customer gets from it is a static HTML report that knows nothing about their account, nothing about the panel’s firewall, and has no idea which of its “visitors” are machines.
Anyone who wanted more added a tag: Google Analytics, Plausible, Fathom. A tag gives a modern screen, but it puts a script on every page, and with Google Analytics the site also needs a consent banner in the EU. A tag also has a blind spot that has become the largest part of the picture. It only counts clients that run JavaScript. GPTBot, ClaudeBot, Meta-ExternalAgent and Googlebot fetch the page and leave without running anything, so the tag never sees them.
The web server sees every request. So the statistics come from there.
What the site owner sees
Statistics in the client panel opens on the site and the range you pick: today, 7 days, 30 days, this month, last month or 12 months. Across the top are visitors, pageviews, bounce rate and bot requests, each with an arrow comparing it to the same number of days just before. Below them are the daily chart and the lists: pages and entry pages, sources, campaigns and referrers, countries, devices, browsers and systems. A Visitors | Bots switch above it all keeps people and crawlers apart.
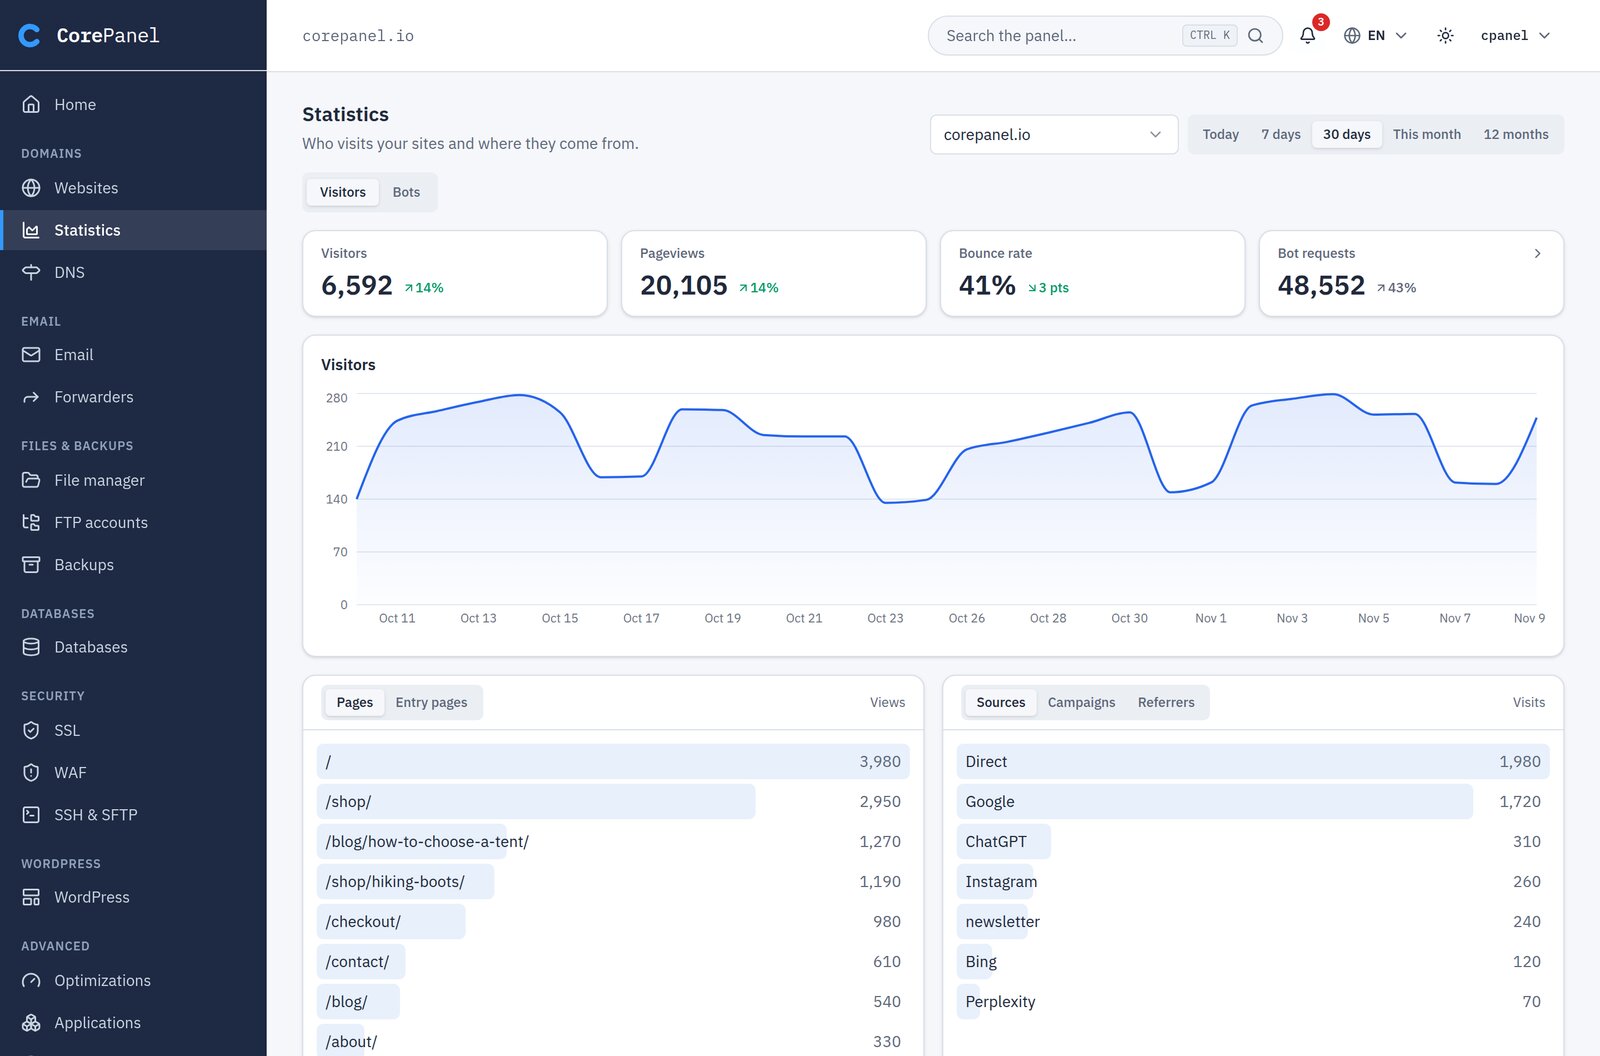
Look at the sources. AI is a source of its own, next to search, social and email:
ChatGPT, Perplexity, Claude, Gemini and Copilot each appear by name. When someone clicks a
link inside an assistant’s answer, the site owner sees which assistant sent them. For a
lot of sites that is now the fastest-growing source of visits, and most analytics still
file it under “referral”. Links tagged with utm_source, utm_medium and utm_campaign
show up under Campaigns with no setup.
It starts working the moment a site is created, and that includes a site that arrived through a migration from cPanel a minute ago.
Click a row, and the whole page follows
Click ChatGPT in Sources and every figure, the chart and every other list narrow to the visits that came from ChatGPT: which pages those people read, from which countries, on which devices. Click a page to add a second filter, and the two combine.
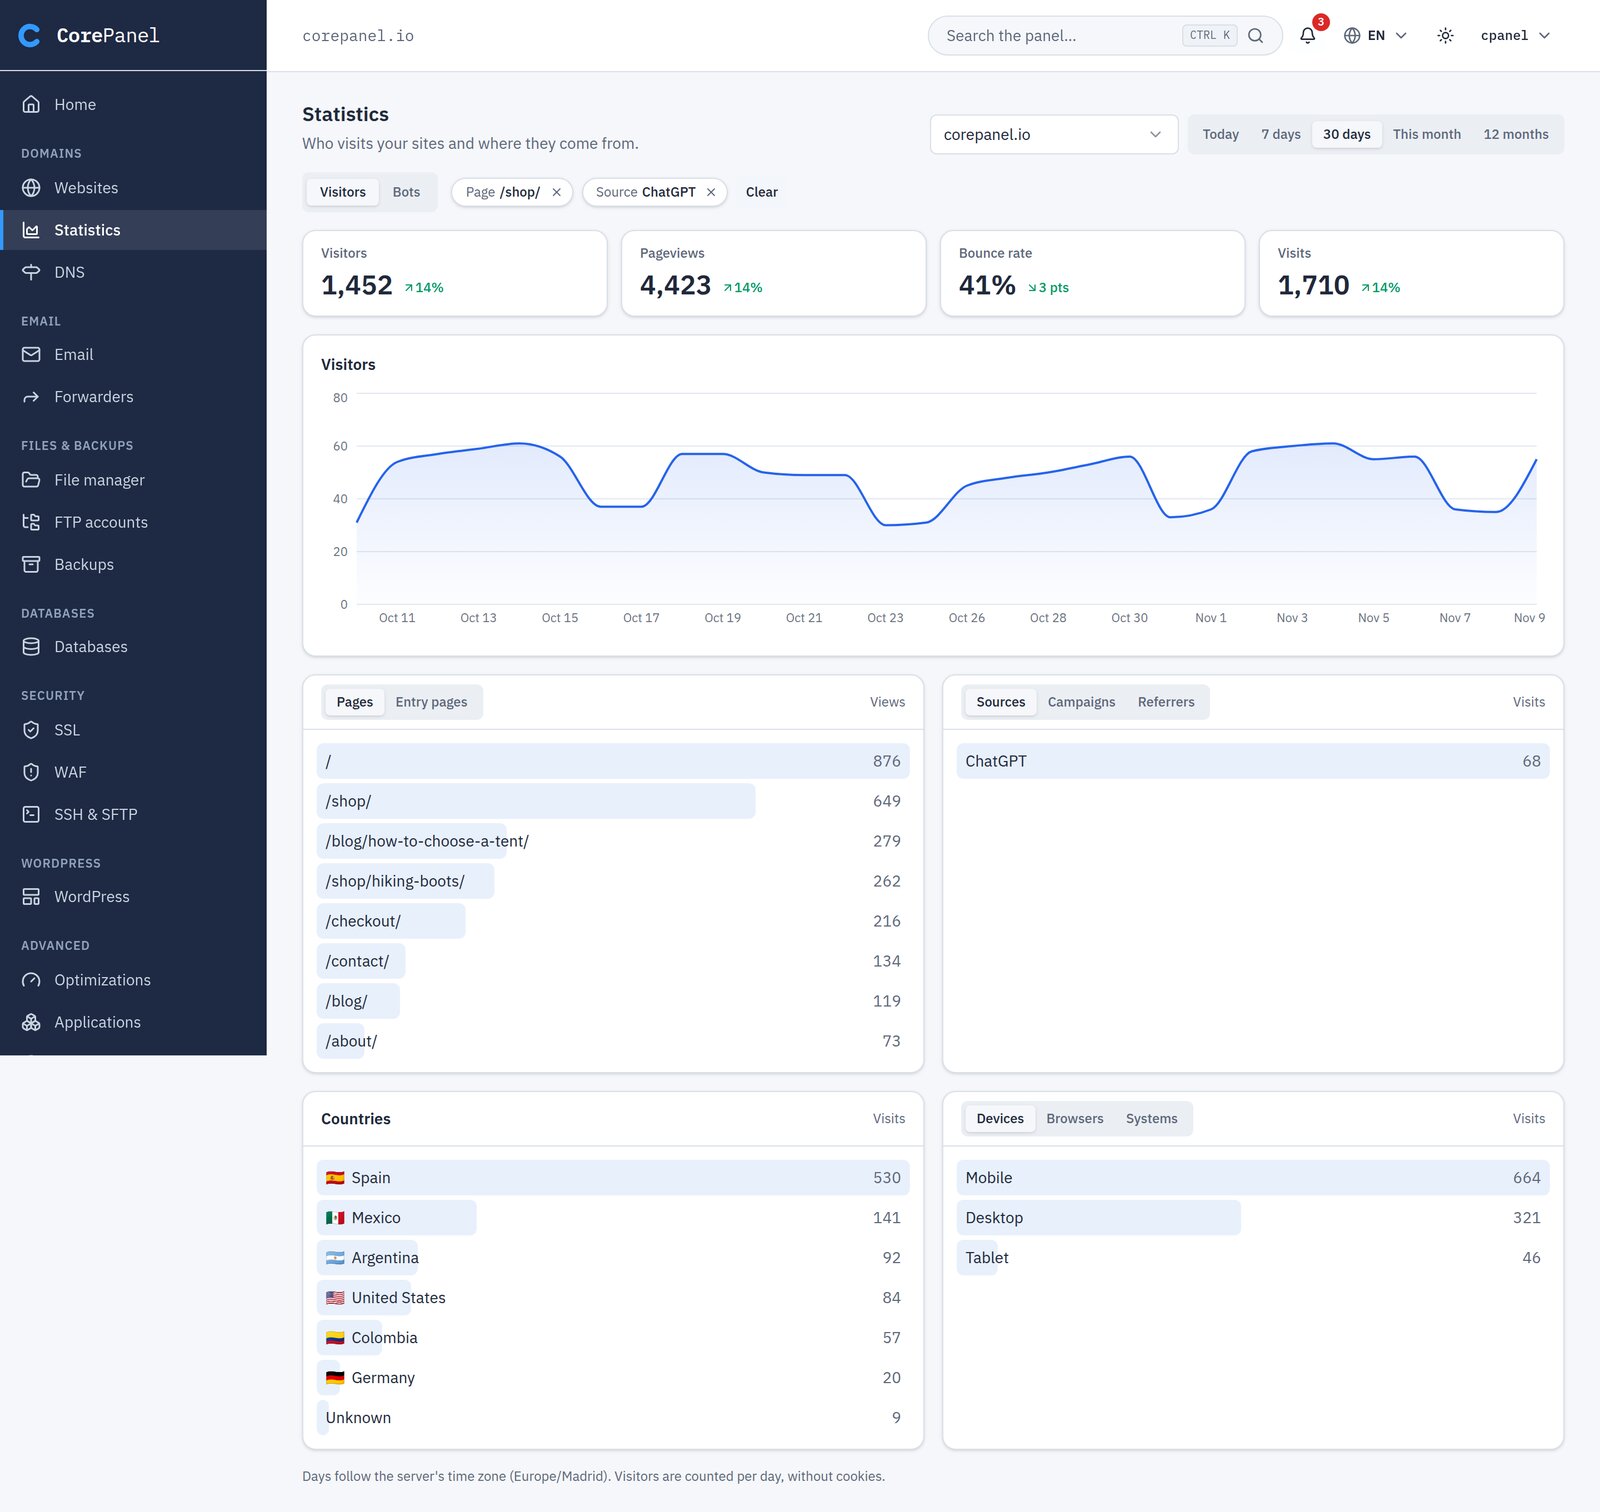
This is what makes a statistics page useful instead of just decorative, and a log analyser normally cannot do it, because it only keeps totals. CorePanel keeps one row per visit for the last 90 days, so filters work on any range up to that. The filters live in the address, so a filtered view can be sent as a link, and Back removes the last one.
The bots get a view of their own
Here is where a log-based tool stops catching up and gets ahead. On our own site, corepanel.net, AI crawlers made 7.4% of all requests over 31 days in August 2026, measured from its access log: Amazonbot, Applebot, ChatGPT-User, Perplexity-User, OAI-SearchBot, GPTBot, Meta-ExternalAgent and ClaudeBot, in that order. A JavaScript tag reports none of it.
The Bots view, one click from the visitors, counts requests instead of visits: how many bots made, their share of all the site’s requests, the data they were sent, and a chart of it day by day. Its Bots & AI card names every crawler that visited the site, sorted by what it cost: the requests it made, the data it was sent, and a small chart of that transfer per day. Most crawled lists the pages they fetch most.
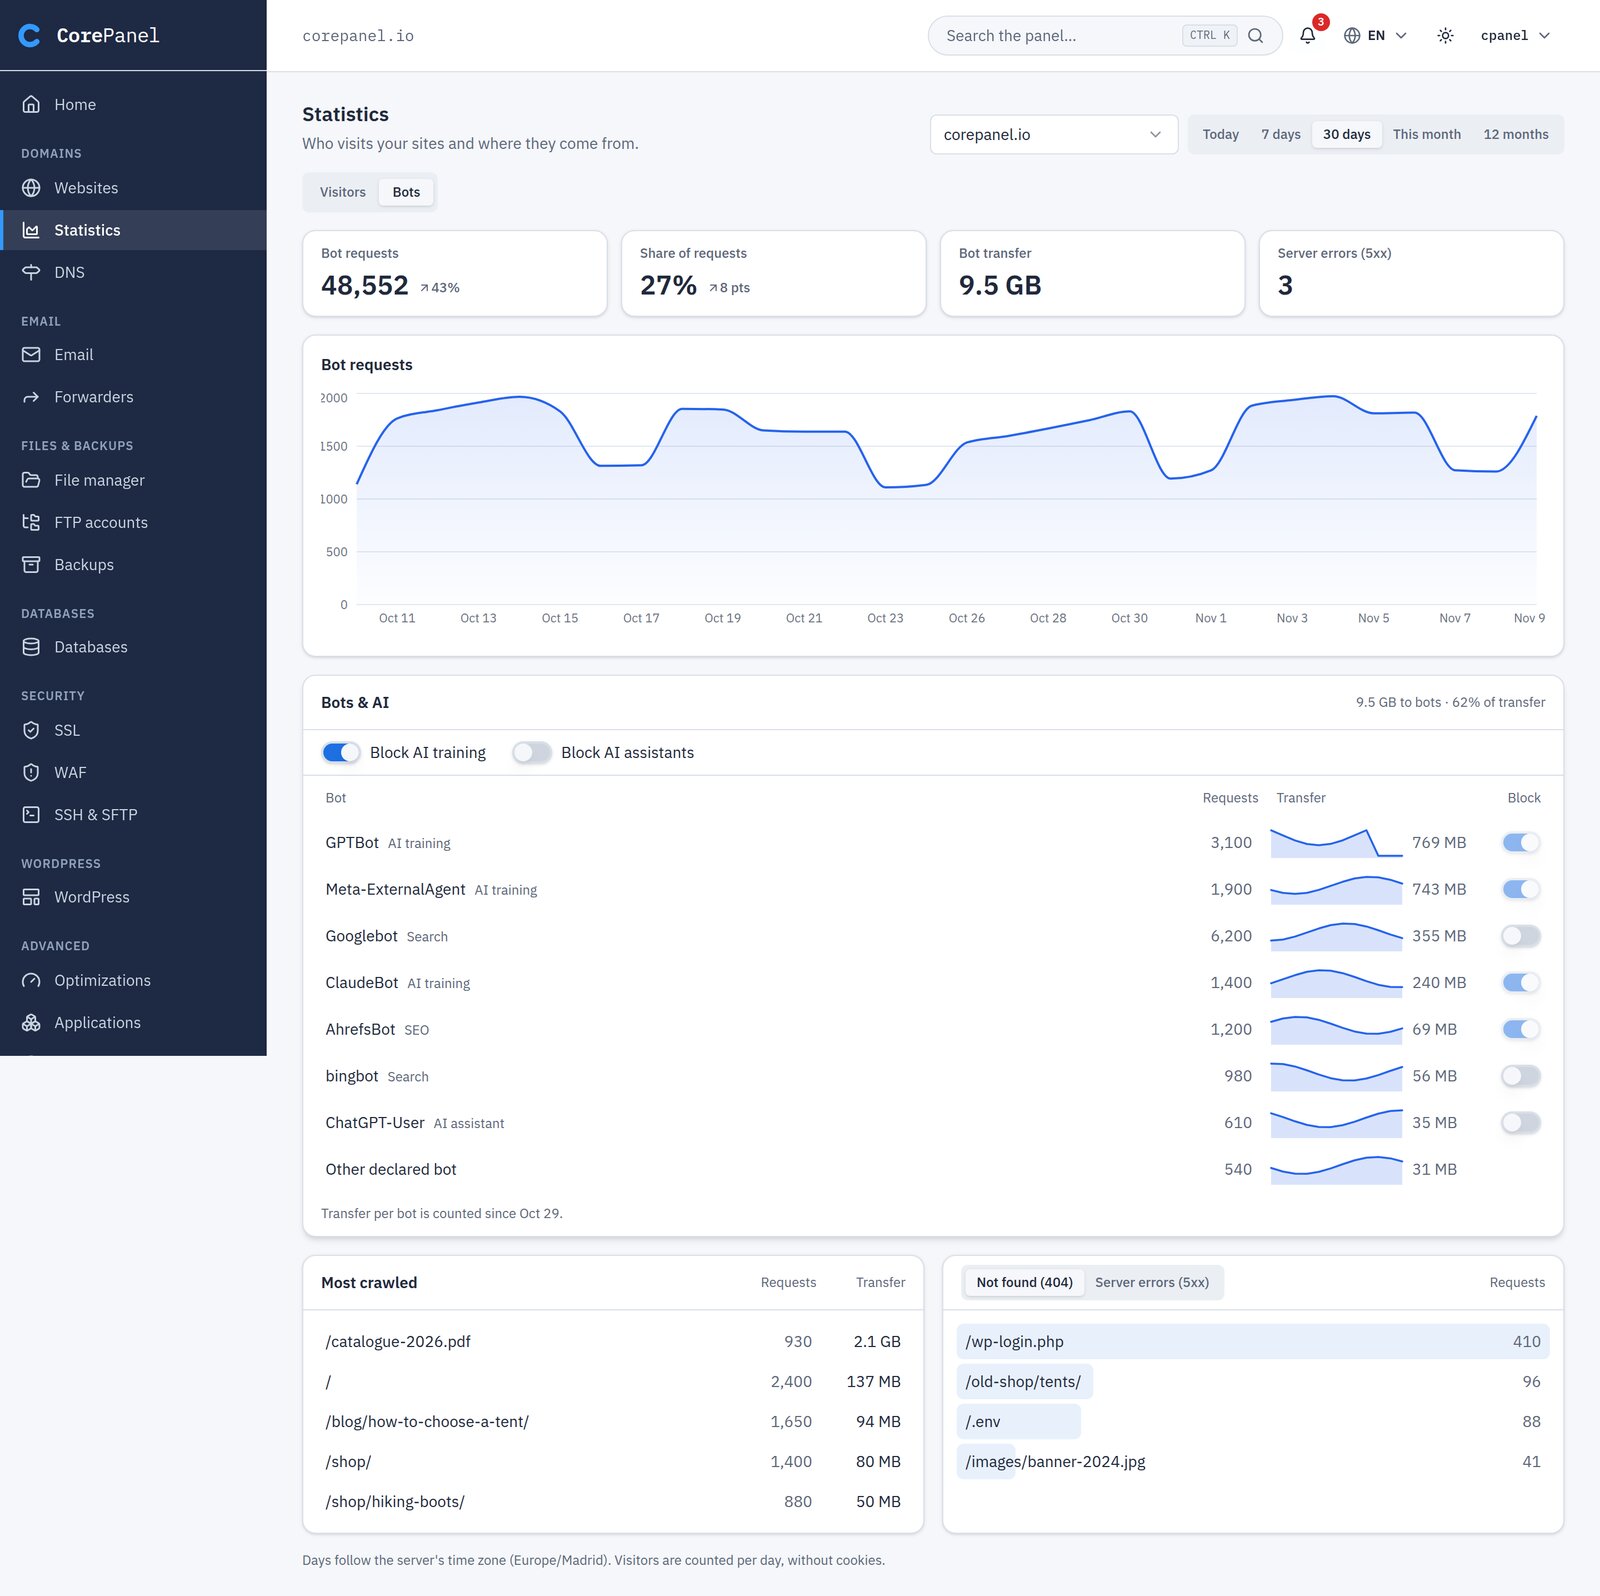
Counting bytes rather than requests is deliberate. A search engine asking for 6,200 pages can cost less than an AI training crawler asking for half as many, and it is the bytes that show up on the bandwidth bill. Once you see them, you can tell whether a crawler is worth what it costs.
Then you decide, from the same screen:
- Block AI training turns away the crawlers that collect pages to train models: GPTBot, ClaudeBot, CCBot, Meta-ExternalAgent and the rest of that category.
- Block AI assistants turns away the ones that fetch a page because someone asked an assistant about it, such as ChatGPT-User and Perplexity-User. The two are kept apart on purpose. Plenty of sites want to stay out of training sets and still be quoted, with a link, in an assistant’s answer.
- Each bot has its own switch. Blocking a search engine asks first, because the site drops out of its results.
A blocked bot gets a 403 on every page except /robots.txt, from the panel’s own
WAF. The block matches the bot by name and never bans an address,
so people sharing a network with a crawler are not affected. Like the WAF itself, it
comes with every edition.
A crawler that hides its name gets caught too. The WAF scores every request on how much it behaves like a real browser, and a client below the threshold counts as automated even when it claims to be Chrome. It is never counted as a visitor.
Errors you can act on
The Bots view also lists Not found (404) and Server errors (5xx), each with the addresses and how often they were hit, from people and bots alike: most 404s are crawlers and scanners probing for files the site never had. The 404 list shows the broken links and old URLs worth redirecting, which is exactly the list you need the week after moving a site. The 5xx list shows which pages are failing for real visitors, before anyone writes in to say so.
The operator’s view: every site on the server
The site owner’s page is one site at a time. The administrator gets Hosting → Statistics: every site on the server in one table, which can be sorted by visitors, pageviews, the bots’ share of requests, bot transfer, 4xx or 5xx.
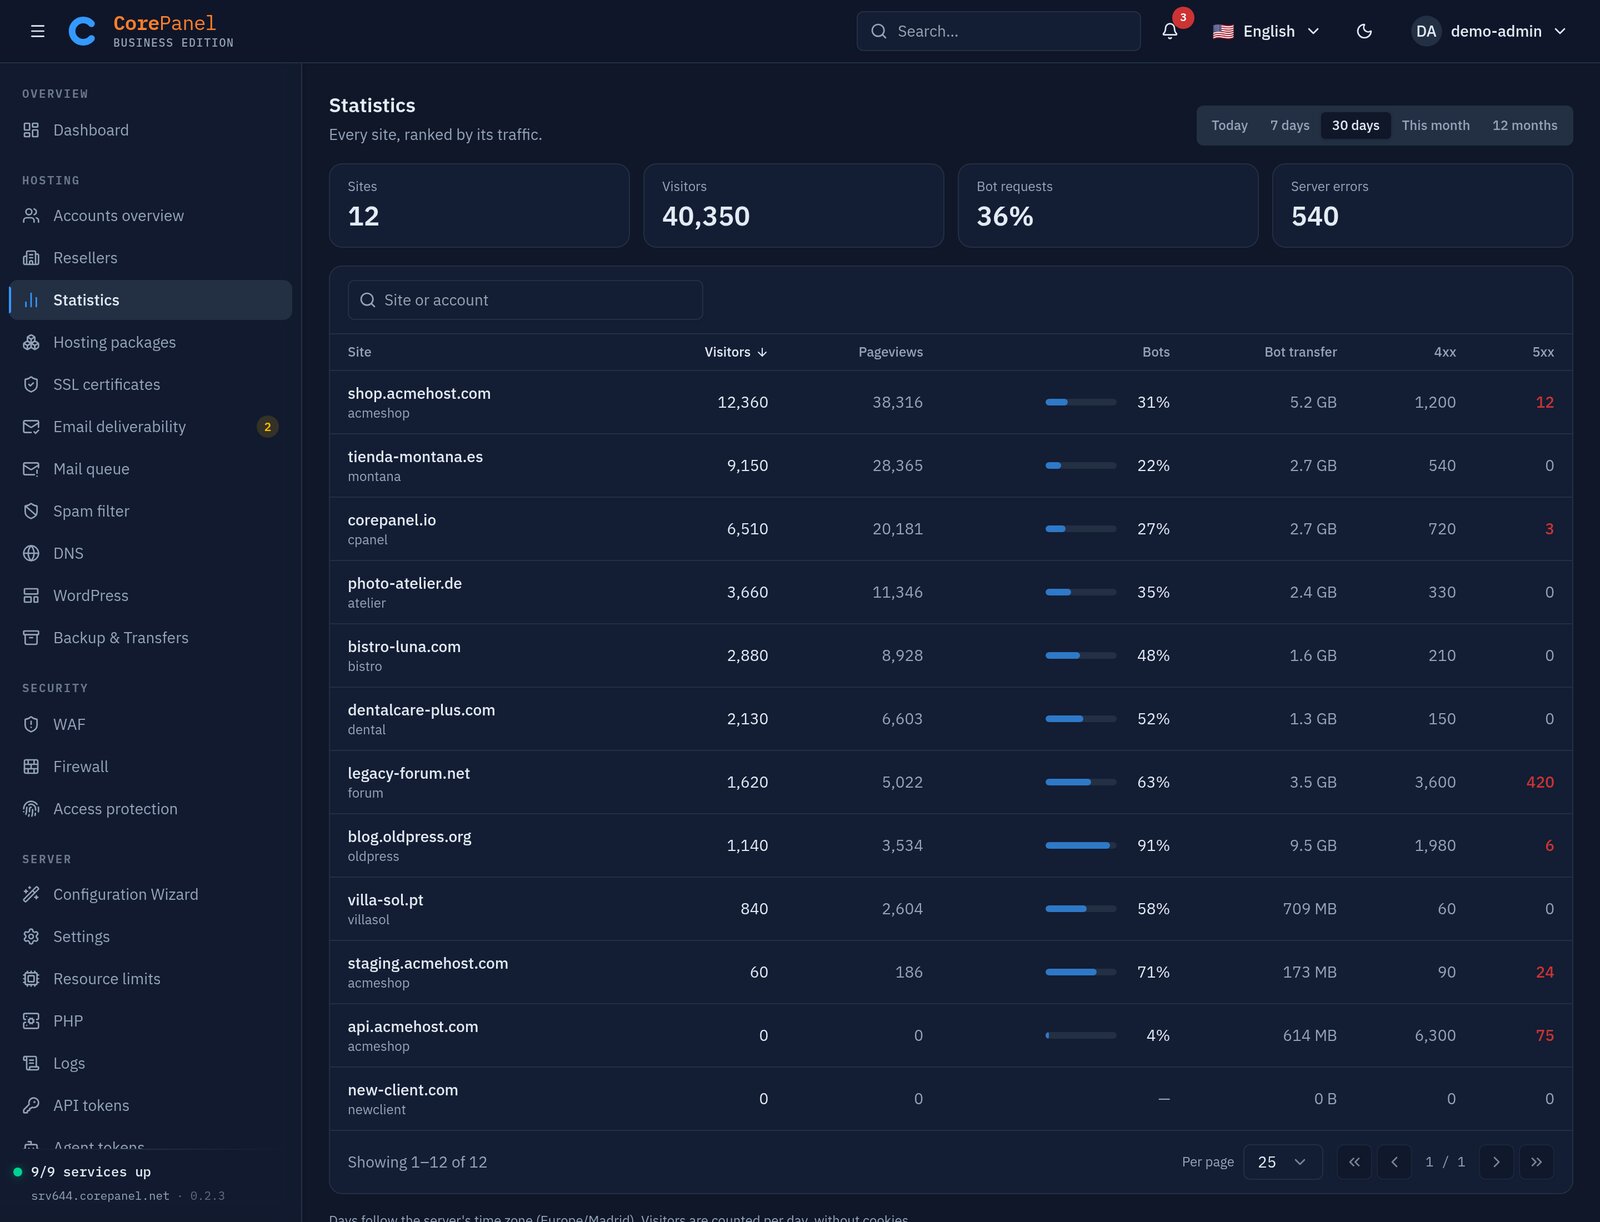
In one screen it answers three questions a hosting provider used to work out by hand:
- Which site has bots driving its bandwidth? Sort by bot transfer.
- Which site is breaking? Sort by 5xx.
- Which site’s DNS never reached the server? Every site is listed, including the ones with no traffic at all, so they stand out.
Click a site and you open the same page its owner sees, switches included. A reseller gets the same view over their own accounts, and only theirs.
How visitors are counted
Privacy is built into how the data is stored, so there is nothing to configure:
- A visitor is a hash of the IP address and the browser’s user agent, salted with a random value that changes every day. When the day closes, the salt is deleted. From then on, nothing can connect a hash to an IP address or link one day’s visitor to the next day’s.
- The country is looked up from the IP address while the log line is read, and the address is discarded right after. Raw IPs never reach the statistics database.
- No cookies, no script, nothing in the page. The visitor’s browser never talks to anything but the site.
- The statistics live in their own database, separate from the panel’s data, and update every ten minutes.
Where it goes next
Three more pieces are in the works: download of the raw access log, a monthly PDF report, and its delivery by email with the hosting provider’s own branding on Pro and Business. The rest is already on every CorePanel server running the current release.
Install CorePanel Personal and open Statistics on any site. It already has data.