# WordPress served without PHP: 1.6 ms instead of 248 ms
> A WordPress site with 400 posts on a 2-vCPU server, measured with the dynamic page cache off and on: TTFB, CPU per page view and pages served per second.
Source: https://www.corepanel.net/blog/we-measured-the-page-cache
Author: CorePanel Team
Published: 2026-08-03
Tags: performance, wordpress, caching, benchmark
From the CorePanel blog — https://www.corepanel.net/blog
---
> **In short:** on a 2-vCPU server running a WordPress site with 400 posts, turning
> CorePanel's dynamic page cache on took the home page from **248 ms to 1.6 ms** to first
> byte and from **266 ms to 1 ms of server CPU** per page view. Under load the same box
> went from **12 pages per second to 5,507**. Pages that cannot be shared — search,
> anything with a logged-in visitor — did not change at all, which is the other half of
> the result.
Every hosting panel claims its cache makes sites faster. The claim is nearly content-free:
of course removing work makes a page arrive sooner. The questions worth answering are
*how much*, *at what cost to the server*, and *on which pages nothing happens at all* —
and those need numbers from a machine, not a landing page.
So we built the site, measured it twice, and are publishing the method along with the
figures.
## The setup
Everything below runs on one deliberately modest server, because that is where the
difference matters. A machine with 32 cores hides a slow page; a small VPS does not.
| | |
|---|---|
| **Server** | AlmaLinux 8.10, 2 vCPU (Xeon Skylake), 3.5 GB RAM |
| **Stack** | CorePanel 0.7.7, CoreHttpd, PHP 8.4.24 via PHP-FPM (`ondemand`, `max_children=8`, OPcache on), MariaDB 10.11 |
| **Site** | WordPress 7.0.2, Twenty Twenty-Five, 400 posts, 25 pages, 2,488 comments, 145 original images rendered into 1,077 files — 508 MB on disk |
| **Fixture** | [`wp-test`](https://github.com/pyxsoft/wp-test) `medium` profile, seed `20260803` |
The site is not a "hello world" WordPress. That matters: a default install with one post
fits entirely in every cache in the system and makes any stack look fast. `wp-test`
generates a site with a real media library, real comment volume and editorial-shaped
content, from a fixed seed, on the machine being measured — so the same fixture can be
rebuilt anywhere without moving gigabytes around.
**OPcache is on in both runs.** Measuring a cache against a deliberately crippled baseline
is how benchmarks become useless.
### How each number was taken
- **TTFB and CPU:** 40 requests per URL over a single keep-alive connection from the box
itself, 5 warm-up requests discarded. Measuring from the same machine removes the
network so what is left is the server's own think time. CPU is read from `/proc` for the
account's PHP-FPM workers, MariaDB and the web server — never the client, so the
measuring tool never counts itself.
- **Throughput:** a keep-alive load generator on a second machine 26 ms away, 20 seconds
per run, against the post permalink (20 KB gzipped). It requests gzip and discards the
compressed bytes without decompressing them — see [the mistake we made
first](#the-mistake-we-made-first-because-you-will-make-it-too). Rate is computed over
the wall clock actually elapsed, which matters with the cache off: requests still in
flight when the run ends take another 30 seconds to drain.
- **The cache was switched through the panel's own API** — the same call the Optimizations
screen makes — not by hand-editing a config file.
## Time to first byte
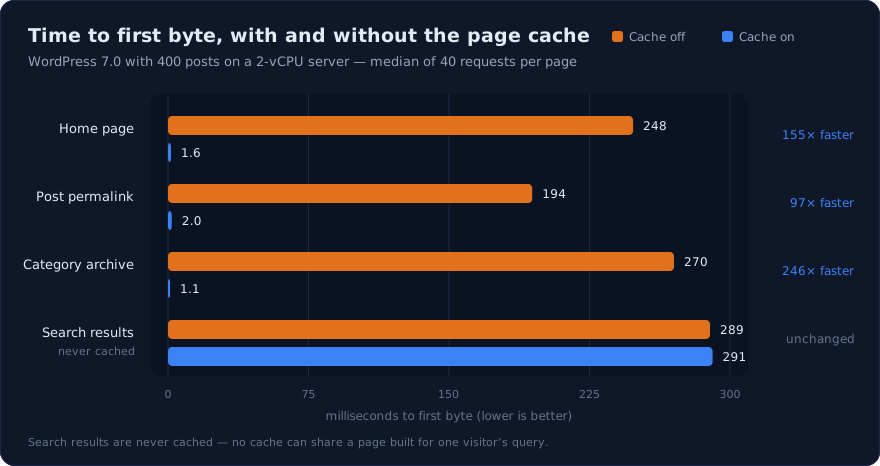
Median of 40 requests per page. Search results are the control: they cannot be cached, and they did not move.
The three cacheable page types land within a couple of milliseconds of each other, which is
the tell that we are no longer measuring WordPress at all. A cache hit does not run a
faster WordPress — it runs no WordPress. What is left is the web server reading a stored
response off disk, and that costs the same whether the page took 194 ms or 270 ms to build.
The uncacheable row is there on purpose. **Search results went from 289 ms to 291 ms**:
noise, no improvement. No cache can share a page built for one visitor's query, and a
cache that claimed otherwise would be a bug report waiting to happen.
## What it costs the server
TTFB is what a visitor feels. CPU per page view is what a server owner pays, and it is the
number that decides how much traffic a machine takes before it needs a bigger one.
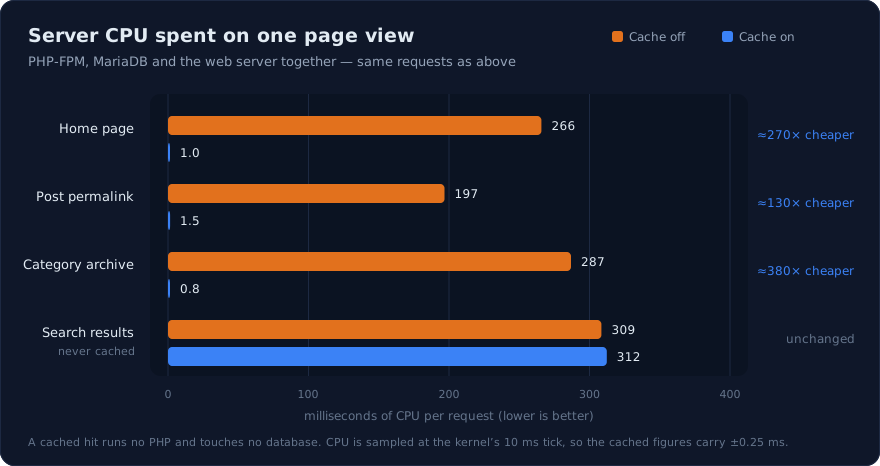
PHP-FPM, MariaDB and the web server summed from /proc. Sampled at the kernel's 10 ms tick, so the cached figures carry about ±0.25 ms.
A quarter of a second of CPU per page view is what an ordinary WordPress page costs. Two
cores can produce four or five of those per second, and that is the whole story of why a
small VPS falls over when a post does well.
At about **1 ms of CPU per cached page view**, the same two cores have roughly two hundred
times more room. Not because anything was optimised — because the work is not done at all.
### Would nginx or Apache have done better?
Twelve pages per second sounds too low until you see where the machine spends itself. With
the cache off and twenty visitors, it sits at **0% idle** — 83% user, 17% system — and that
time divides roughly like this:
| php-fpm | ~87% |
|---|---|
| mariadbd | ~9% |
| the web server | ~4% |
So swapping the web server out puts you in competition for that last 4%. Even a rival that
cost *nothing at all* would take 12.1 pages per second to about 12.6. nginx and Apache both
hand the request to the same PHP-FPM pool, which then does the same quarter-second of work;
the bottleneck is not who speaks HTTP, it is who runs PHP. We have not benchmarked them
here, and we are not claiming a win we did not measure — we are saying the measurement
would be about the pool and the database, not about the server in front of them.
The figure is also self-consistent: 197 ms of CPU per view of this permalink, over two
cores, predicts about 10 pages per second. We measured 12.1, on a machine with nothing left
to give.
**With the cache on, the comparison becomes a real one** — no PHP runs, so what you are
timing *is* the web server. There the real rivals are nginx with `fastcgi_cache` or
Apache with `mod_cache`, and we would expect them in the same order of magnitude; serving a
stored file quickly is not where servers differ much. What differs is everything in the
next section: whether the stored copy is allowed to live for a year, and who gets to say it
has gone stale.
## What that becomes under load
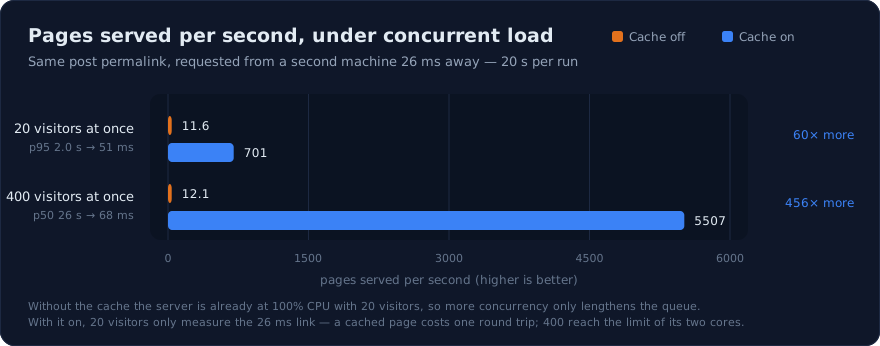
Requested from a second machine 26 ms away, 20 s per run, same post permalink.
Two things in that chart deserve to be said out loud rather than left for a reader to
catch:
**The two "cache off" bars are the same because the server was already full.** With 20
concurrent visitors the box sat at 100% CPU. Adding 380 more visitors did not produce a
single extra page per second — it produced a queue. Median latency went from 1.7 s to
26.5 s, and p99 reached 33.8 s. That is what a WordPress site does the day it gets
attention it wasn't built for.
**A cached page costs one round trip.** At 20 concurrent visitors the median response
takes 26.7 ms, which is the link's own latency and nothing else: 701 pages per second is
simply 20 requests divided by that. The server is barely awake. It takes 400 concurrent
visitors to ask it for everything it has, and that is where the 5,507 comes from — at
which point its two cores, not the network, are the limit.
Latency from the visitor's side: at 20 concurrent visitors, p95 went from **2.03 s to
51 ms** — half of that 51 is the network. At 400, p95 with the cache on was 124 ms.
### Two mistakes we made first, because you will make them too
**The load generator measured itself.** The first run reported 1,512 pages per second. It
asked for gzip and decompressed every response — 164 MB/s of gunzip on a two-core client.
Requesting the same gzipped bytes and *not* decompressing them, from the same client over
the same link, the same server served 2.4× more with nothing changed on the machine under
test. A real visitor decompresses one page on their own device; your load generator
decompresses thousands on yours.
**Then the benchmark found a bug in our own web server.** Even with that fixed, the tell
was still there: at 400 concurrent visitors the machine sat about a third idle while the
number refused to climb, and a saturated result with an idle server is never the server's
limit. It was ours. Every response served from the cache was emitting `Connection: close`
— four of four consecutive hits, over HTTP/1.1 and HTTP/2 alike — while uncached responses
kept the connection open. The one path built to be fast was the only one paying a TCP, and
over TLS a full, handshake per page.
The header appears nowhere in the stored entry, which is why it survived review: the web
server keeps "close" as an internal flag, and the code that replays a cached response onto
a live one re-armed it. One entry carrying that flag was enough to make every later hit
close.
Fixing it moved every number on the cached side: 254 → 701 pages per second at 20
visitors, 3,537 → 5,507 at 400, and the median response at 20 visitors from 78 ms down to
the 26.7 ms above — the 78 was three round trips, because each page was paying for a new
connection. The figures in this post are from the fixed build ([corehttpd
0.7.8](https://www.corepanel.net/docs/web/optimizations)); the uncached side did not move at all, which is exactly
what you want to see, since none of that code runs when there is nothing cached to serve.
That is the argument for measuring your own product properly: the benchmark was worth
more as a bug report than as a number.
## Why the cache is allowed to be this aggressive
A cache this effective is only safe if it never guesses. CorePanel's does not: a companion
plugin inside WordPress declares, on every single response, whether the page may be shared,
for how long, and which URLs have just gone stale.
That contract is what allows the cached copy to live for up to **a year** instead of the
five minutes a timer-based cache has to settle for. Freshness does not come from expiry, it
comes from invalidation: publishing or editing a post drops its permalink, the front page,
its term archives, its post type archive, the feed and the sitemaps — on the very response
that made the change, so a reload already shows the new page.
It also refuses cheerfully. A logged-in visitor, anything in a cart, a response that sets
its own cookie: not shared, ever. And where it can, it solves the problem instead of
refusing — a page whose form carries a one-time security token stays cacheable, but its
lifetime is capped a minute short of the token's own, so the cached copy never hands out a
token that has expired.
## What this measurement does not show
- **A site that is not WordPress is not cached at all.** Without an application that can
say what is shareable and which URLs to invalidate, the answer is not to cache.
- **A shop or a membership site will see far less.** Most of their traffic is personal to
each visitor, which is the row of the first chart that did not move — not a failure of
the cache, a description of the traffic. That is exactly why the panel has an *Evaluate*
mode that measures how much of *your* traffic is cacheable before you serve anything from
cache.
- **This is one fixture on one machine.** The ratio you get depends on how heavy your PHP
is and how much of your traffic can be shared. Both charts would look very different on a
four-core box with a lighter theme — smaller absolute times, similar shape.
- **Cold cache still costs full price.** The first visitor to each URL pays the 248 ms, and
a purge sends every affected URL back to that state.
## Try the same measurement
Nothing here needs our tooling. The fixture generator is public, and every figure above
comes from two commands' worth of setup:
```bash
# On the server under test, as the site's own user:
git clone https://github.com/pyxsoft/wp-test.git && cd wp-test
./build.sh --profile medium --path ~/public_html --url https://example.com \
--db-name wp_bench --db-user wp_bench --db-pass 'secret'
```
Then measure with the cache off, turn it on in **Optimizations** (or
`corepanel domain optimizations set example.com --page-cache on`), warm it, and measure
again.
Quote the `wp-test-manifest.json` the build leaves behind when you publish the result — a
number without its fixture is not a result.
The dynamic page cache is part of the **Speed Optimizer** in [CorePanel Pro](https://www.corepanel.net/pricing).
WebP and Early Hints, the other two optimizations in that screen, are in every edition
including the free Personal one — and [we measured those too](https://www.corepanel.net/blog/webp-without-a-plugin).