# An Elementor site, measured: the cache buys visitors, HTTP/3 buys seconds
> A real Elementor site on a 2-vCPU server, measured: the page cache took 400 simultaneous visitors from a queue to a shrug, HTTP/3 halved the wait, and WebP turned a 14.3 MB page into 75 KB.
Source: https://www.corepanel.net/blog/elementor-cache-webp-http3
Author: CorePanel Team
Published: 2026-08-04
Tags: performance, wordpress, elementor, caching, benchmark
From the CorePanel blog — https://www.corepanel.net/blog
---
> **In short:** we built a real Elementor site — 30 builder pages, 2,399 widgets, eight
> plugins — on a 2-vCPU server and measured it properly. CorePanel's page cache took the
> home page from **0.51 seconds to 0.001 seconds** of server work; with 400 visitors
> arriving at once, the uncached site served **251 pages and left 231 people waiting a
> minute for nothing**, while the cached one served **78,946** and nobody waited more than
> a tenth of a second. Then we switched the defaults back on: **HTTP/3 nearly halved what
> the visitor waits** — 1.03 seconds to a finished page instead of 2.14 — while **WebP
> saved 55 KB and no time on the home page, and 14.3 MB and four seconds on a page of
> oversized PNGs.** Three optimisations, three completely different kinds of win.
If you build sites in Elementor, you have had this conversation. The site looks
beautiful, the client is happy, and then someone says it feels slow — or a newsletter
goes out and the site falls over for twenty minutes. The usual advice is a list of
plugins to install and settings to tick, none of it measured on your kind of site.
So we built that kind of site and measured it properly.
## The site we built
Not a demo with three posts. A site shaped like the ones agencies actually ship:
| | |
|---|---|
| **Built with** | Elementor 4.2.1, plus Essential Addons and Header Footer Elementor |
| **The rest of the stack** | Yoast SEO, Contact Form 7, WP Mail SMTP, Redirection, UpdraftPlus |
| **Pages** | 30 built in the builder — home, services, contact, portfolio, team, pricing… |
| **Inside those pages** | **2,399 widgets**, stored as 1.37 MB of layout data |
| **The rest of the content** | 120 blog posts, 367 comments, 70 photographs in 459 files |
| **Total** | 140 MB, on WordPress 7.0.2 |
| **Home page** | 233 KB of HTML, 58 files for the browser to fetch |
It runs on a deliberately modest server — **2 vCPU, 3.5 GB of RAM, AlmaLinux 8**, running
CorePanel 0.7.7 with PHP 8.4 and MariaDB. A big machine hides a slow page; a small one
tells the truth, and it is what most sites of this size actually live on.
The site is not ours to describe from memory: it comes from
[`wp-test`](https://github.com/pyxsoft/wp-test), a public generator that builds the same
site from the same seed on any machine. Anything below can be rebuilt and re-measured by
someone who does not believe us.
## Why an Elementor page is expensive
This is the part worth understanding, because it explains everything that follows.
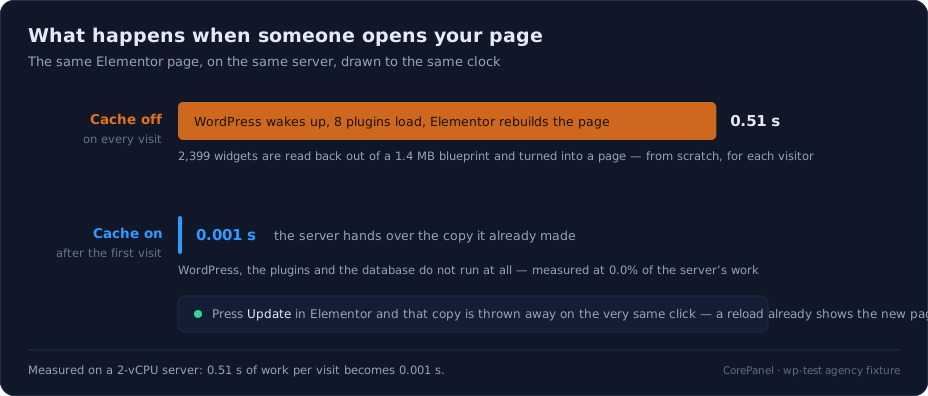
When you design a page in Elementor, the builder does not save an HTML page. It saves a
**blueprint** — a long structured description of every section, column, heading, button
and image box you placed. On our home page, that blueprint is 2,399 widgets.
Every time a visitor opens the page, the server reads that blueprint and builds the page
again from scratch: it starts WordPress, loads all eight plugins, hands the blueprint to
Elementor, asks the database for the content, and assembles the HTML. Then the visitor
after them arrives, and it does the whole thing again. And again.
On our server, that work takes **0.51 seconds** — every single time.
The page cache does not make the rebuild faster. It skips it.
A page cache is the obvious idea, then: build the page once, keep the result, hand that
same result to everyone else. The hard part is not the keeping — it is knowing when the
copy has gone stale, and which pages must never be shared at all. More on that below.
## How long the server takes to answer
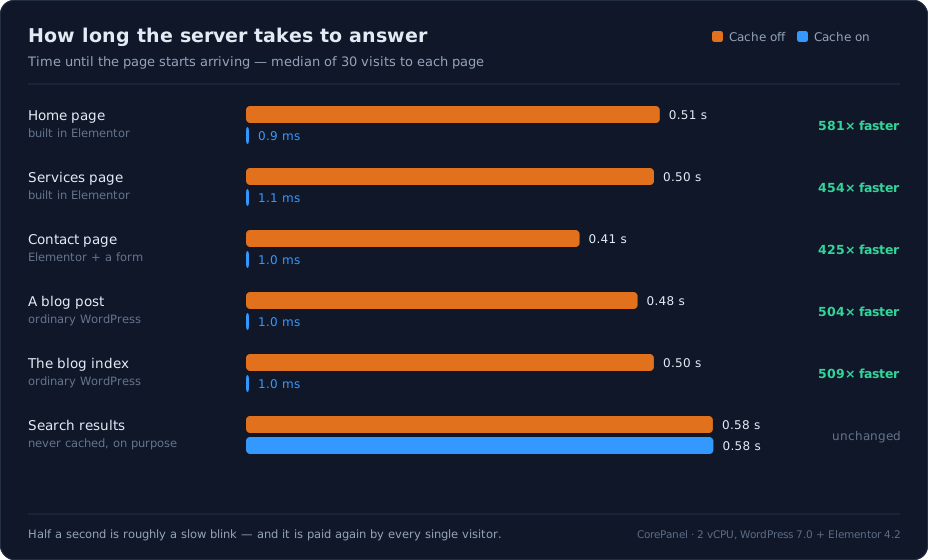
Median of 30 visits to each page, measured on the server itself so the network is not part of the number.
Every page built in the builder lands in roughly the same place — around one
millisecond — whether it took 0.41 or 0.51 seconds to build. That is the tell that we are
no longer measuring Elementor at all: a cached page does not run a faster builder, it
runs no builder. What is left is a file being handed over, and that costs the same
whatever was in it.
The last row is there on purpose. **Search results went from 0.58 s to 0.58 s.** No cache
can share a page built for one person's search box, and one that claimed otherwise would
be a bug, not a feature.
The same thing measured from the server's side: an uncached view of the home page costs
**516 milliseconds of processor time**. A cached one costs **0.7**. Nothing was
optimised — the work simply is not done.
## What that changes when everyone arrives at once
Here is the part that matters more than the stopwatch, and the reason a slow site is a
business problem rather than an annoyance.
Half a second of processor time per visit, on two cores, is a hard ceiling of about four
pages per second. It does not matter how patient your visitors are: the fifth one that
second is queuing.
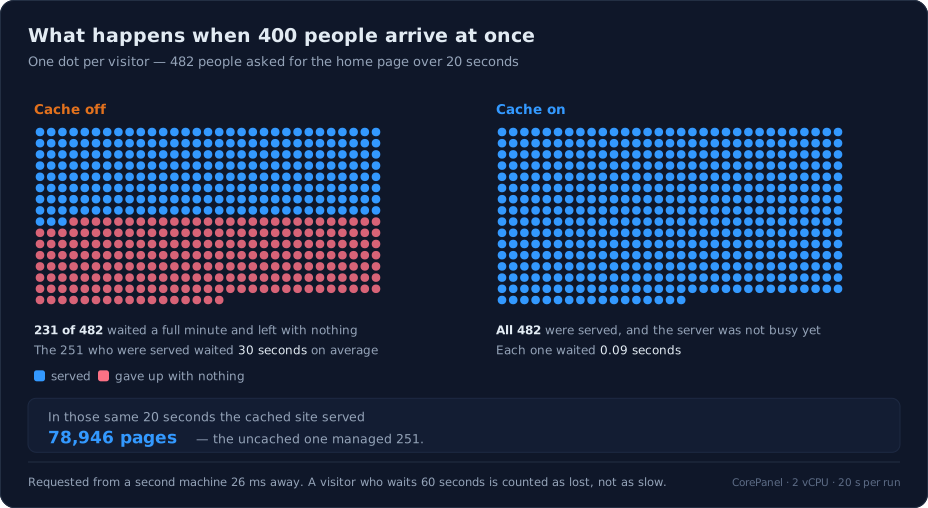
Requested from a second machine 26 ms away. Someone who waits 60 seconds is counted as lost, not as slow.
With the cache off and 400 people arriving together, the machine sat at **94% busy** and
still only delivered 251 pages in twenty seconds. Nearly half the visitors — 231 of
482 — waited a full minute and got nothing at all. The ones who were served waited
**thirty seconds** on average.
With the cache on, the same box served **78,946 pages** in the same twenty seconds, every
visitor answered in **0.09 seconds**, none refused — and it was still 9% idle. Of the work
it did do, **the web server accounted for 82%. PHP and the database measured 0.0%.**
That is the real shape of the change: not that your site is quicker on a quiet afternoon,
but that the afternoon it gets attention stops being the afternoon it goes down.
## What the visitor actually sees
Now the limits, and the reason this post does not claim your site becomes 500× faster.
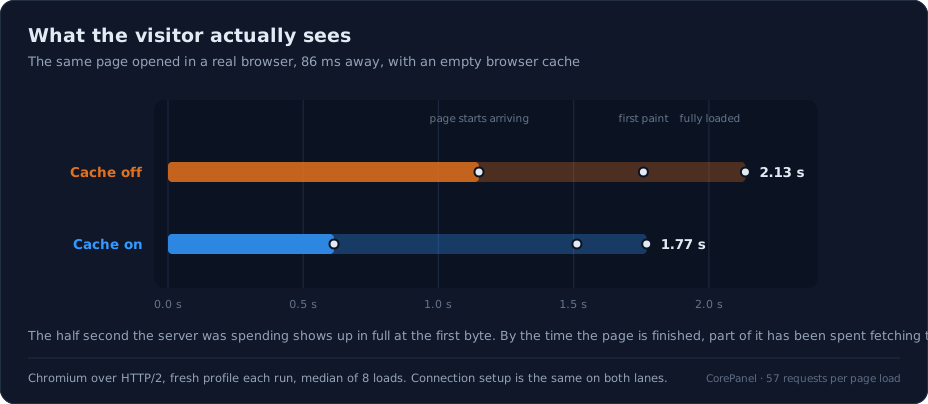
Chromium over HTTP/2, a fresh profile for every run, eight loads per state, alternated so network drift hits both equally.
| What the visitor gets | Cache off | Cache on |
|---|---|---|
| The page starts arriving | 1,150 ms | **614 ms** |
| First paint | 1,758 ms | **1,512 ms** |
| Largest element painted (LCP) | 1,948 ms | **1,512 ms** |
| Page finished | 2,135 ms | **1,770 ms** |
The half second the server was spending shows up **in full at the first byte** — 536
milliseconds of it, which is exactly what the rebuild cost. By the time the page is
finished, the saving has shrunk to 365 milliseconds, because part of that wait would have
gone on fetching the other 56 files anyway.
One line in that table is worth more than the rest. With the cache on, **the largest
element paints at the same instant as the first paint** — 1,512 and 1,512. Without it, LCP
trails first paint by 190 ms. LCP is the number Google actually measures, and a page that
finishes painting the moment it starts is a different page to a search engine.
What the cache does *not* do is equally clear: the other second is the connection being
opened, the security handshake, and 57 files travelling to the visitor's device. **A page
cache does not make your images smaller, your page simpler, or the visitor's phone
faster.** So we went and turned on the two things that address the rest.
## Then we switched the defaults back on
Everything above was measured with the rest of CorePanel's optimizations switched off, so
that the only variable was the cache. That is not how a site actually ships: **WebP
conversion is on by default in every edition, and so is HTTP/3.** We had turned the first
one off for the experiment; the second we simply had not measured yet, because the load
tests were deliberately run over HTTP/1.1 — with HTTP/2 a load generator multiplexes 400
"visitors" onto a handful of connections, which measures one browser opening a page rather
than a crowd arriving.
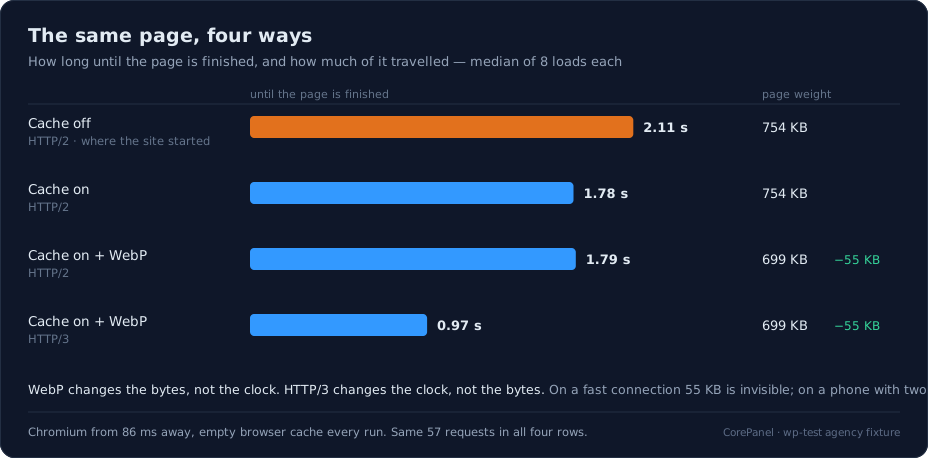
For what a visitor experiences, though, the protocol is exactly the question. So we
measured all four combinations in one window.
Median of eight loads per row, alternated inside a single window. Same 57 requests in every row.
**WebP changed the bytes and not the clock — on this page.** It went from 754 KB to
699 KB, the images from 383 KB to 329 KB, and the load time did not move: 1.79 s against
1.78 s, which is noise. On an 86-millisecond connection with bandwidth to spare, 55 KB is
invisible.
That is a true result and a misleading one, because it is a fact about our home page
rather than about WebP. The images on it are photographs at sensible sizes. The pages that
make people say "the site is slow" usually are not.
So we built the page they actually have. Six of the fixture's own PNGs — 2 to 3.5 MB
each — placed in a layout that displays them 480 pixels wide, which is the single most
common thing we see on a real builder site: a graphic uploaded at full resolution and
shrunk with a width setting.
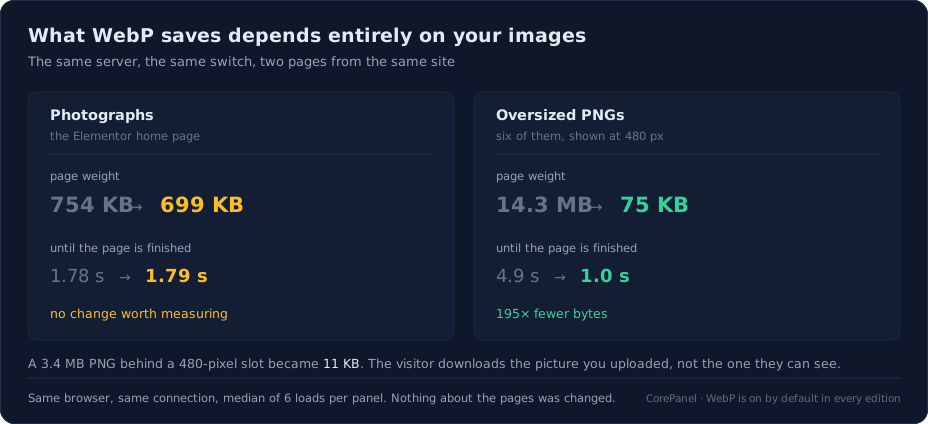
Same server, same switch, two pages of the same site. Median of six loads per panel.
**That page weighs 14.3 MB with the switch off and 75 KB with it on** — 195 times less —
and it finishes loading in **1.0 second instead of 4.9**. The individual conversions are
almost comical: a 3.47 MB PNG became 11 KB, a 2.23 MB one became 9 KB. Flat graphics,
screenshots, logos and charts are what PNG is worst at and WebP is best at, and nobody
notices the difference on screen.
Nothing about those pages was changed to get that: no plugin, no re-export, no
regenerating thumbnails. The originals stay on disk exactly as they were uploaded, and a
browser that cannot read WebP still receives them. The visitor simply stops downloading a
2,048-pixel picture to look at it in a 480-pixel box.
So the summary is not "WebP saves 7%". It is: **on well-prepared photographs it
saves bytes you will not feel, and on the oversized PNG somebody dropped into a page last
year it saves seconds.** Ours is a site with the first problem and not the second, which is
why the first measurement looked so unimpressive. [We measured the conversion itself in
more detail here](https://www.corepanel.net/blog/webp-without-a-plugin).
**HTTP/3 changed the clock and not the bytes.** Same files, same 699 KB, and the page
finishes in **0.97 seconds instead of 1.79**. First paint fell from 1.51 s to 0.74 s, and
LCP from 1.51 s to 0.80 s. Nothing was optimised — the same responses simply travelled
over QUIC instead of TCP, which is where a page like this one has the most to gain: an
Elementor page requests dozens of small files at once, and that is precisely the case
where TCP's head-of-line blocking hurts and QUIC does not have any.
Two caveats on that number. A browser only learns a site speaks HTTP/3 from the
`Alt-Svc` header on a first response, so **the very first page a new visitor opens is
HTTP/2** and everything after it is HTTP/3. And to force it in a test we had to let the
browser accept our self-signed certificate — the `ERR_QUIC_PROTOCOL_ERROR` we hit first
was the certificate, not the server.
### What we expected to help, and didn't
Two things worth reporting because they are the advice you will be given elsewhere.
**Setting image dimensions.** The usual first suggestion for a builder page. On this one
it can return nothing: 19 of the 21 images already carry `width` and `height` — WordPress
has emitted them since 5.5 — and the measured layout shift is **CLS 0.0005**, which is
zero with rounding. There is no shift to fix. It is also the wrong lever for first paint:
proportions prevent the page jumping around, they do not make it appear sooner.
**Minifying CSS and JavaScript.** CorePanel can do it, and here it did nothing: first
paint 1,484 ms with it on against 1,480 ms with it off. The reason is not subtle once you
look — Elementor already ships its assets minified (`frontend.min.css` and friends), so
there is nothing left to squeeze.
What does stand between the HTML and the first paint on this page is **30 render-blocking
stylesheets**, queued by Elementor, its two add-ons and the other five plugins. Over
HTTP/2 the browser waits 887 ms for them; over HTTP/3, 466 ms. Shortening that queue is
work on your side of the screen — fewer plugins, fewer widget types, Elementor's own
conditional CSS loading — and no server setting substitutes for it.
## When the copy is thrown away
A cache this aggressive is only safe if it never guesses, and CorePanel's does not guess.
A small companion plugin inside WordPress tells the server, on every single response,
whether that page may be shared and which addresses have just gone out of date.
In practice this means what you would want it to mean: **press Update in Elementor and
the old copy is dropped on that very click.** Not in five minutes, not when a timer runs
out — on the response that saved your change. Reload and you are looking at the new page.
The same happens when you publish a post: its own address, the front page, the archives
it belongs to and the feeds all go at once.
And it refuses when it should. A visitor who is logged in gets a freshly built page, every
time. So does anything with a shopping cart, and any page that sets its own cookie. A
contact form stays cacheable, but its copy is deliberately given a shorter life than the
security token inside it, so nobody is ever handed a form that has quietly expired.
## The two numbers are the same number
It is worth putting the two halves of this next to each other, because they are usually
sold as a trade-off and here they are not.
| | Where it started | Where it ended | |
|---|---|---|---|
| Largest element painted, for one visitor | 1.95 s | **0.80 s** | 2.4× sooner |
| Page finished, for one visitor | 2.14 s | **1.03 s** | 2.1× sooner |
| Pages delivered with 400 visitors at once | 251 in 20 s | **78,946 in 20 s** | 314× more |
| Visitors who got nothing | 231 of 482 | **none** | |
Normally you buy one of those with the other: you make a site feel faster by doing more
work per visitor, or you serve more visitors by giving each of them less. Here the same
change does both, because **the time the visitor spends waiting and the time the server
spends working are the same half second.** Remove it and the visitor gets their page
sooner *and* the machine is free to answer somebody else — 314 times over.
The credit is not evenly split, and it should not be reported as though it were. **The
capacity is entirely the page cache**: HTTP/3 moves bytes faster but PHP still runs, so
without the cache the ceiling stays at four pages a second. **The visible speed is mostly
HTTP/3**, with the cache contributing the half second at the front. **WebP contributed
neither on this page and four seconds on the next one** — which is the whole lesson about
image optimisation: its value is set by what you uploaded, not by the server.
## What this measurement does not show
- **A site that is not WordPress is not cached at all.** Without an application that can
say what may be shared and what has gone stale, the answer is not to cache.
- **A shop or a membership site will see much less.** Most of their traffic is personal to
each visitor — the row of the first chart that did not move. That is not a failure of
the cache, it is a description of the traffic. It is also why the panel has an
*Evaluate* mode that measures how much of *your* traffic could be cached before it
serves anything from cache.
- **The first visitor to each page still pays full price.** Someone has to trigger the
build; the cache is what stops it happening again. The same goes after every update.
- **This is one site on one machine.** Yours will differ with how heavy your builder pages
are and how much of your traffic can be shared. The shape will not.
- **The server measurements ran over HTTP/1.1**, one connection per visitor, which is the
realistic model of a crowd. The browser measurements ran over HTTP/2 and HTTP/3, which is
what a visitor actually gets. Mixing the two would flatter both.
- **Early Hints does nothing once the cache is on**, and we measured that rather than
assuming it: a cache hit emits no `103` at all, because those hints are sent while PHP
is still thinking and a cached page does no thinking. With the cache off it does help —
the page finished 240 ms sooner — which is an argument for the cache, not against the
hints.
## Try it on your own site
The cache lives in **Optimizations** in the panel, per domain, with three settings:
off, *Evaluate* — which decides and reports without serving anything from cache, so you
can see what would happen first — and on. From the command line:
```bash
corepanel domain optimizations set example.com --page-cache on
```
It is part of the **Speed Optimizer** in [CorePanel Pro](https://www.corepanel.net/pricing). The other two need no
decision at all: **WebP conversion and HTTP/3 are on by default in every edition,
including the free Personal one** — the only reason they were off in the first half of
this post is that we turned them off to isolate the cache.
And if you would rather not take our word for any of the above, the whole fixture is
public and deterministic:
```bash
# On the server under test, as the site's own user:
git clone https://github.com/pyxsoft/wp-test.git && cd wp-test
./build.sh --profile agency --path ~/public_html --url https://example.com \
--db-name wp_bench --db-user wp_bench --db-pass 'secret'
```
That builds this exact site — same widgets, same photographs, same 2,399-widget home
page. Measure it, turn the cache on, warm it, and measure it again. The load generator we
used is in the same repository (`bench/loadgen.go`), and it reports the visitors who gave
up alongside the ones who were served — a number most benchmarks quietly leave out.
Every figure above came from that fixture, and
[the previous run of the same method](https://www.corepanel.net/blog/we-measured-the-page-cache) — on a
photography-heavy site rather than a builder-heavy one — is worth reading next if you
want to see how much of this is Elementor and how much is WordPress.